Fortrade Canada Ltd. as an order-execution only dealer is not permitted to provide you with any advice or recommendations. These Market Commentaries should not be construed as a recommendation, advice or any attempt by Fortrade Canada Ltd. to prompt or influence you in making an investment decision to purchase, sell, hold or exchange any security or to influence the timing of such activity. This content is produced by Fortrade Limited which is not registered in any capacity with any securities regulatory authority in Canada.
69% of retail investor accounts lose money when trading CFDs with this provider.
CFDs are complex instruments and come with a high risk of losing money rapidly due to leverage. 69% of retail investor accounts lose money when trading CFDs with this provider. You should consider whether you understand how CFDs work and whether you can afford to take the high risk of losing your money.
70.88% of retail investor accounts lose money when trading CFDs with this provider.
CFDs are complex instruments and come with a high risk of losing money rapidly due to leverage. 70.88% of retail investor accounts lose money when trading CFDs with this provider. You should consider whether you understand how CFDs work and whether you can afford to take the high risk of losing all your money. Read full risk warning.
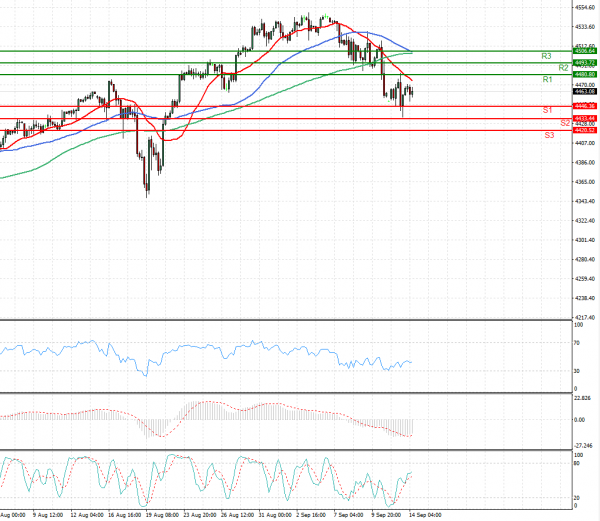
US Session Analysis for CFD Instruments 14/09/2021
Fundamental analysis
14 September, 2021
U.S. stock futures edged higher ahead of fresh data that is likely to show that inflation remained elevated in August. Futures tied to the S&P 500 and the Dow Jones Industrial Average ticked up almost 0.2%, indicating that both indexes will post tepid gains after the opening bell. The S&P 500 had eked out a modest increase on Monday. Contracts for the technology heavy Nasdaq-100 were relatively flat. Investors are showing signs of cautious optimism this week as they bet that the economy will continue to recover, bolstering corporate earnings. That marks a shift from last week, when a rise in Delta variant cases of Covid-19 had stoked concerns that measures to contain the virus could weigh further on economic activity or slow the shipping of goods and materials, adding to inflationary pressures.