Fortrade Canada Ltd. as an order-execution only dealer is not permitted to provide you with any advice or recommendations. These Market Commentaries should not be construed as a recommendation, advice or any attempt by Fortrade Canada Ltd. to prompt or influence you in making an investment decision to purchase, sell, hold or exchange any security or to influence the timing of such activity. This content is produced by Fortrade Limited which is not registered in any capacity with any securities regulatory authority in Canada.
69% of retail investor accounts lose money when trading CFDs with this provider.
CFDs are complex instruments and come with a high risk of losing money rapidly due to leverage. 69% of retail investor accounts lose money when trading CFDs with this provider. You should consider whether you understand how CFDs work and whether you can afford to take the high risk of losing your money.
67.52% of retail investor accounts lose money when trading CFDs with this provider.
CFDs are complex instruments and come with a high risk of losing money rapidly due to leverage. 67.52% of retail investor accounts lose money when trading CFDs with this provider. You should consider whether you understand how CFDs work and whether you can afford to take the high risk of losing all your money. Read full risk warning.
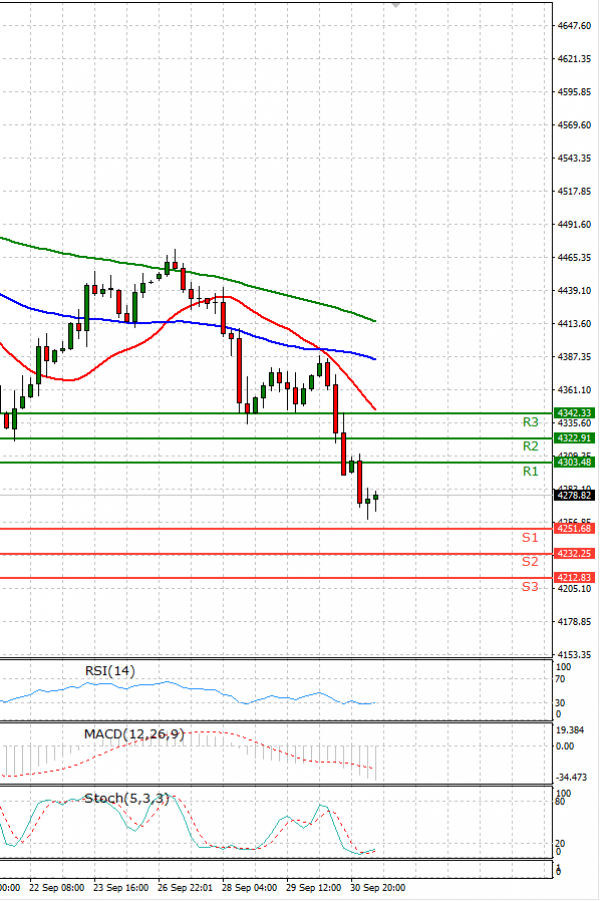
US Session Analysis for CFD Instruments 01/10/2021
Fundamental analysis
01 October, 2021
A selloff in shares of cyclical companies drove major indexes lower Thursday, capping a tumultuous September that marked the S&P 500’s worst month since March 2020. All three major U.S. indexes finished the day lower after a choppy session. Stocks jumped to start the day, but then quickly wobbled and turned negative, with losses accelerating in the final minutes of trading. The Dow Jones Industrial Average fell 1.6%, to end at 33843.92, weighed down by losses in companies ranging from machinery giant Caterpillar to home-improvement retailer Home Depot .