Fortrade Canada Ltd. as an order-execution only dealer is not permitted to provide you with any advice or recommendations. These Market Commentaries should not be construed as a recommendation, advice or any attempt by Fortrade Canada Ltd. to prompt or influence you in making an investment decision to purchase, sell, hold or exchange any security or to influence the timing of such activity. This content is produced by Fortrade Limited which is not registered in any capacity with any securities regulatory authority in Canada.
70% of retail investor accounts lose money when trading CFDs with this provider.
CFDs are complex instruments and come with a high risk of losing money rapidly due to leverage. 70% of retail investor accounts lose money when trading CFDs with this provider. You should consider whether you understand how CFDs work and whether you can afford to take the high risk of losing your money.
70.41% of retail investor accounts lose money when trading CFDs with this provider.
CFDs are complex instruments and come with a high risk of losing money rapidly due to leverage. 70.41% of retail investor accounts lose money when trading CFDs with this provider. You should consider whether you understand how CFDs work and whether you can afford to take the high risk of losing all your money. Read full risk warning.
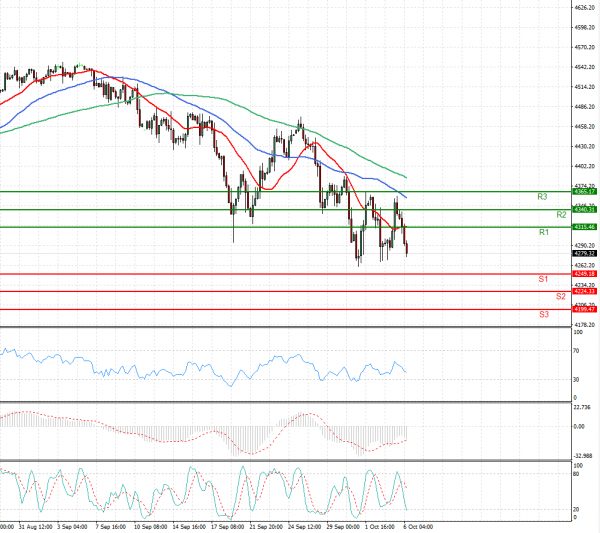
US Session Analysis for CFD Instruments 06/10/2021
Fundamental analysis
06 October, 2021
U.S. stock futures fell and bond yields rose Wednesday, pointing to another bumpy day on Wall Street as investors gird for a spell of higher inflation, driven by roaring energy markets. Futures for the S&P 500 dropped 1%. The broad stocks index rose 1.1% on Tuesday, clawing back some losses incurred in a technology-driven selloff at the start of the week. Contracts for the tech-focused Nasdaq-100 fell 1.1% on Wednesday, suggesting tech stocks could face fresh losses at the opening bell. Futures for the Dow Jones Industrial Average lost 0.8%. U.S. government bonds extended a recent selloff. Yields on 10-year Treasury notes—which move in the opposite direction to the price of the bonds—rose to 1.561% from 1.528% Tuesday.