Fortrade Canada Ltd. as an order-execution only dealer is not permitted to provide you with any advice or recommendations. These Market Commentaries should not be construed as a recommendation, advice or any attempt by Fortrade Canada Ltd. to prompt or influence you in making an investment decision to purchase, sell, hold or exchange any security or to influence the timing of such activity. This content is produced by Fortrade Limited which is not registered in any capacity with any securities regulatory authority in Canada.
71% of retail investor accounts lose money when trading CFDs with this provider.
CFDs are complex instruments and come with a high risk of losing money rapidly due to leverage. 71% of retail investor accounts lose money when trading CFDs with this provider. You should consider whether you understand how CFDs work and whether you can afford to take the high risk of losing your money.
70.41% of retail investor accounts lose money when trading CFDs with this provider.
CFDs are complex instruments and come with a high risk of losing money rapidly due to leverage. 70.41% of retail investor accounts lose money when trading CFDs with this provider. You should consider whether you understand how CFDs work and whether you can afford to take the high risk of losing all your money. Read full risk warning.
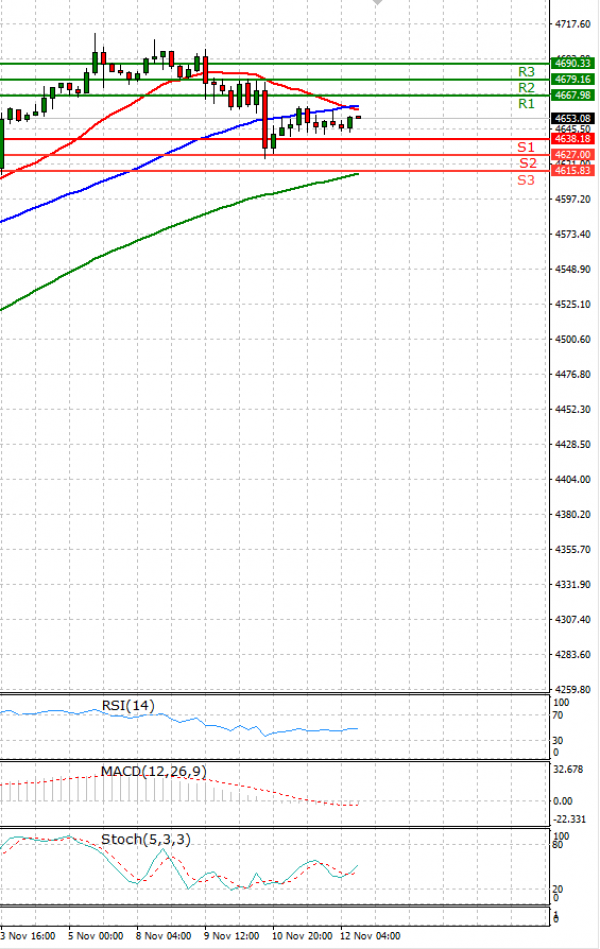
US Session Analysis for CFD Instruments 12/11/2021
Fundamental analysis
12 November, 2021
Stocks were poised to snap a five-week winning streak, knocked by concerns about high levels of inflation. Futures for the S&P 500 edged up less than 0.1% Friday, pointing to a small opening advance for the benchmark index. The S&P 500 has fallen 1% so far this week, interrupting a streak of gains that kicked off when U.S. companies began to report strong earnings in mid-October. A pullback in recent sessions followed data showing inflation rose to a three-decade high in October and broadened to an array of goods and services. Signs that the flare-up in inflation will last longer than central bankers had forecast prompted traders to bet the Federal Reserve would raise borrowing costs by summer