Fortrade Canada Ltd. as an order-execution only dealer is not permitted to provide you with any advice or recommendations. These Market Commentaries should not be construed as a recommendation, advice or any attempt by Fortrade Canada Ltd. to prompt or influence you in making an investment decision to purchase, sell, hold or exchange any security or to influence the timing of such activity. This content is produced by Fortrade Limited which is not registered in any capacity with any securities regulatory authority in Canada.
69% of retail investor accounts lose money when trading CFDs with this provider.
CFDs are complex instruments and come with a high risk of losing money rapidly due to leverage. 69% of retail investor accounts lose money when trading CFDs with this provider. You should consider whether you understand how CFDs work and whether you can afford to take the high risk of losing your money.
67.52% of retail investor accounts lose money when trading CFDs with this provider.
CFDs are complex instruments and come with a high risk of losing money rapidly due to leverage. 67.52% of retail investor accounts lose money when trading CFDs with this provider. You should consider whether you understand how CFDs work and whether you can afford to take the high risk of losing all your money. Read full risk warning.
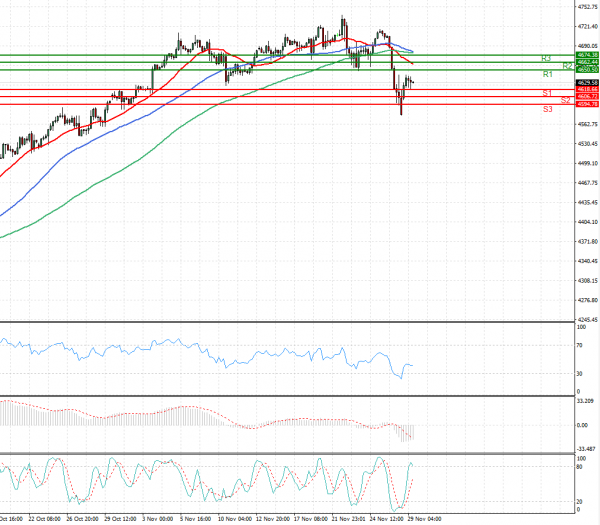
US Session Analysis for CFD Instruments 29/11/2021
Fundamental analysis
29 November, 2021
Oil prices and U.S. stock futures gained, indicating that markets might recoup some losses from Friday’s selloff, as investors bet that the impact of the Omicron Covid-19 variant can be limited by updates to existing vaccines. Futures for the S&P 500 gained 0.6% Monday. The index suffered its worst one-day percentage decline since February on Friday after South Africa identified a fast-spreading strain of the coronavirus, which the World Health Organization has named Omicron. Contracts for the tech-focused Nasdaq-100 gained 0.9% Monday and futures for the Dow Jones Industrial Average added 0.4%.