Fortrade Canada Ltd. as an order-execution only dealer is not permitted to provide you with any advice or recommendations. These Market Commentaries should not be construed as a recommendation, advice or any attempt by Fortrade Canada Ltd. to prompt or influence you in making an investment decision to purchase, sell, hold or exchange any security or to influence the timing of such activity. This content is produced by Fortrade Limited which is not registered in any capacity with any securities regulatory authority in Canada.
69% of retail investor accounts lose money when trading CFDs with this provider.
CFDs are complex instruments and come with a high risk of losing money rapidly due to leverage. 69% of retail investor accounts lose money when trading CFDs with this provider. You should consider whether you understand how CFDs work and whether you can afford to take the high risk of losing your money.
67.52% of retail investor accounts lose money when trading CFDs with this provider.
CFDs are complex instruments and come with a high risk of losing money rapidly due to leverage. 67.52% of retail investor accounts lose money when trading CFDs with this provider. You should consider whether you understand how CFDs work and whether you can afford to take the high risk of losing all your money. Read full risk warning.
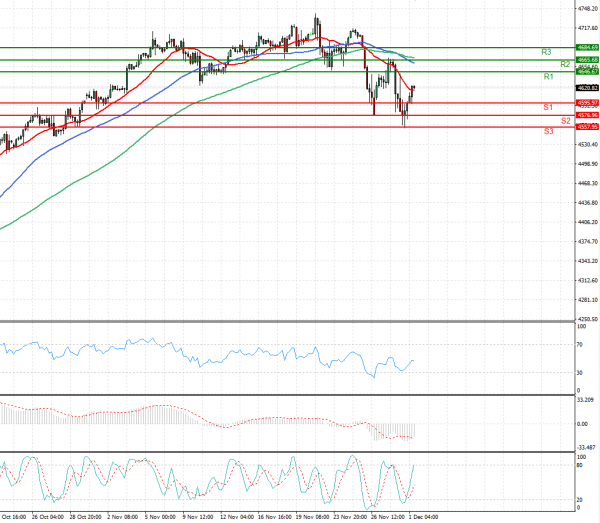
US Session Analysis for CFD Instruments 01/12/2021
Fundamental analysis
01 December, 2021
U.S. stock futures and oil prices rose, suggesting markets will claw back some losses sparked by worries over the Omicron variant and the unwinding of Federal Reserve stimulus. Investors have little to go on as they assess whether the variant will lead to renewed restrictions in the U.S. and elsewhere and, if so, how governments and central banks would respond to support the economy. Though drugmakers have said the variant first identified in southern Africa looks like it could make existing vaccines less effective, they expect to be able to update the shots. Investors say a return to full-scale lockdowns is unlikely. The uncertainty has led to seesaw moves in global markets that extended into Wednesday. Futures for the S&P 500 rose 1.2%, signaling gains for the benchmark index. The S&P 500 fell 1.9% Tuesday, closing out a decline for November after a late-month dive sparked by the emergence of Omicron.