Fortrade Canada Ltd. as an order-execution only dealer is not permitted to provide you with any advice or recommendations. These Market Commentaries should not be construed as a recommendation, advice or any attempt by Fortrade Canada Ltd. to prompt or influence you in making an investment decision to purchase, sell, hold or exchange any security or to influence the timing of such activity. This content is produced by Fortrade Limited which is not registered in any capacity with any securities regulatory authority in Canada.
70% of retail investor accounts lose money when trading CFDs with this provider.
CFDs are complex instruments and come with a high risk of losing money rapidly due to leverage. 70% of retail investor accounts lose money when trading CFDs with this provider. You should consider whether you understand how CFDs work and whether you can afford to take the high risk of losing your money.
70.41% of retail investor accounts lose money when trading CFDs with this provider.
CFDs are complex instruments and come with a high risk of losing money rapidly due to leverage. 70.41% of retail investor accounts lose money when trading CFDs with this provider. You should consider whether you understand how CFDs work and whether you can afford to take the high risk of losing all your money. Read full risk warning.
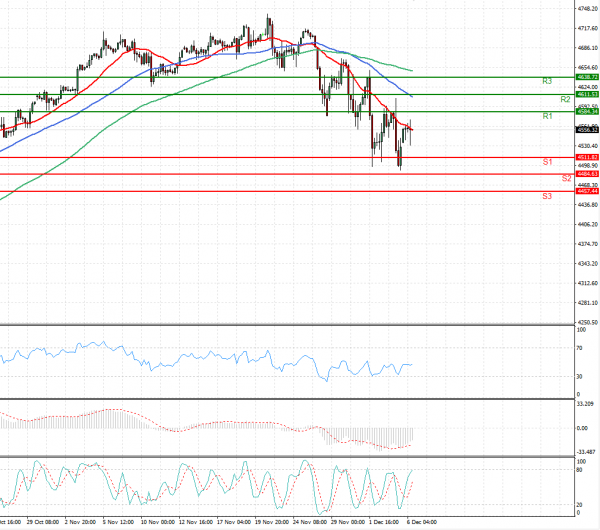
US Session Analysis for CFD Instruments 06/12/2021
Fundamental analysis
06 December, 2021
U.S. stock futures rose on early indicators that Omicron may be causing milder illness than previously feared, while bitcoin and other cryptocurrencies edged up from weekend lows. Futures tied to the S&P 500 climbed 0.5% Monday, suggesting the broad-market index may regain some ground, after closing down 0.8% Friday. Dow Jones Industrial Average futures added 0.7%, while Nasdaq-100 futures edged up 0.2%.
In recent days, markets have swung on conflicting signals from scientists and vaccine makers regarding the severity of the Omicron variant and how well existing vaccines may work against it. It still may be weeks before a more definitive picture forms. Some positive news emerged over the weekend, boosting market sentiment. A small study of people hospitalized from Omicron in South Africa found a pattern of milder illness than in previous waves of Covid-19, though scientists cautioned that it was too early to say for sure.