Fortrade Canada Ltd. as an order-execution only dealer is not permitted to provide you with any advice or recommendations. These Market Commentaries should not be construed as a recommendation, advice or any attempt by Fortrade Canada Ltd. to prompt or influence you in making an investment decision to purchase, sell, hold or exchange any security or to influence the timing of such activity. This content is produced by Fortrade Limited which is not registered in any capacity with any securities regulatory authority in Canada.
71% of retail investor accounts lose money when trading CFDs with this provider.
CFDs are complex instruments and come with a high risk of losing money rapidly due to leverage. 71% of retail investor accounts lose money when trading CFDs with this provider. You should consider whether you understand how CFDs work and whether you can afford to take the high risk of losing your money.
70.91% of retail investor accounts lose money when trading CFDs with this provider.
CFDs are complex instruments and come with a high risk of losing money rapidly due to leverage. 70.91% of retail investor accounts lose money when trading CFDs with this provider. You should consider whether you understand how CFDs work and whether you can afford to take the high risk of losing all your money. Read full risk warning.
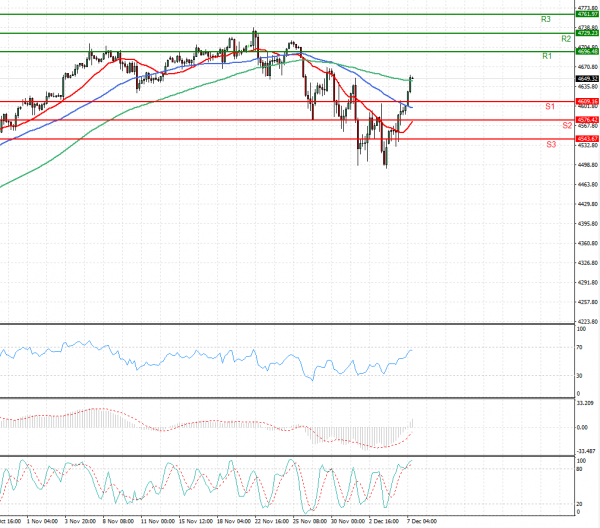
US Session Analysis for CFD Instruments 07/12/2021
Fundamental analysis
07 December, 2021
U.S. stock futures climbed as investors bet that the impact of the Omicron variant of Covid-19 would be milder than previously thought. Futures for the S&P 500 gained 1.1% Tuesday. The index jumped Monday, recouping nearly all its losses for last week. Contracts for the tech-focused Nasdaq-100 jumped 1.7% Tuesday, and futures for the Dow Jones Industrial Average rose 0.8%. Hopes that the new strain will have a less pronounced impact on travel and consumer confidence have bolstered stocks this week. Scientists and vaccine makers are still assessing the severity of Omicron and how well existing vaccines may work against it. Lower trading volumes in the lead-up to the holidays are likely to cause exaggerated moves in either direction, analysts say.