Fortrade Canada Ltd. as an order-execution only dealer is not permitted to provide you with any advice or recommendations. These Market Commentaries should not be construed as a recommendation, advice or any attempt by Fortrade Canada Ltd. to prompt or influence you in making an investment decision to purchase, sell, hold or exchange any security or to influence the timing of such activity. This content is produced by Fortrade Limited which is not registered in any capacity with any securities regulatory authority in Canada.
71% of retail investor accounts lose money when trading CFDs with this provider.
CFDs are complex instruments and come with a high risk of losing money rapidly due to leverage. 71% of retail investor accounts lose money when trading CFDs with this provider. You should consider whether you understand how CFDs work and whether you can afford to take the high risk of losing your money.
70.91% of retail investor accounts lose money when trading CFDs with this provider.
CFDs are complex instruments and come with a high risk of losing money rapidly due to leverage. 70.91% of retail investor accounts lose money when trading CFDs with this provider. You should consider whether you understand how CFDs work and whether you can afford to take the high risk of losing all your money. Read full risk warning.
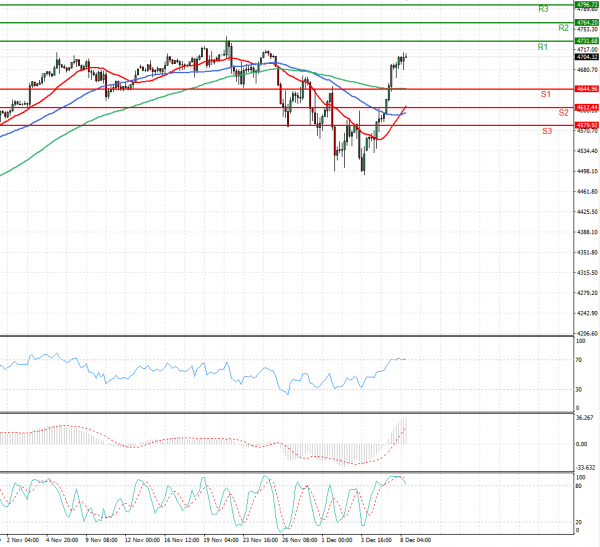
US Session Analysis for CFD Instruments 08/12/2021
Fundamental analysis
08 December, 2021
U.S. stocks were poised for gains at the opening bell, potentially pushing the S&P 500 toward record territory, amid optimism that the economic impact of Omicron will be less drastic than first feared. Futures the S&P 500 rose 0.3% Wednesday, a day after the benchmark index posted its biggest one-day jump since March and closed just shy of an all-time high. Contracts for the Dow Jones Industrial Average edged up 0.2% and futures for the Nasdaq-100 rose 0.5%, pointing to a strong start to the session for technology stocks. Elsewhere, stocks have snapped back after swooning when the Omicron variant first emerged in late November. Investors have pointed to evidence that Omicron might cause less severe illness than previous variants, though scientists are still assessing its virulence and ability to evade vaccines.