Fortrade Canada Ltd. as an order-execution only dealer is not permitted to provide you with any advice or recommendations. These Market Commentaries should not be construed as a recommendation, advice or any attempt by Fortrade Canada Ltd. to prompt or influence you in making an investment decision to purchase, sell, hold or exchange any security or to influence the timing of such activity. This content is produced by Fortrade Limited which is not registered in any capacity with any securities regulatory authority in Canada.
71% of retail investor accounts lose money when trading CFDs with this provider.
CFDs are complex instruments and come with a high risk of losing money rapidly due to leverage. 71% of retail investor accounts lose money when trading CFDs with this provider. You should consider whether you understand how CFDs work and whether you can afford to take the high risk of losing your money.
70.91% of retail investor accounts lose money when trading CFDs with this provider.
CFDs are complex instruments and come with a high risk of losing money rapidly due to leverage. 70.91% of retail investor accounts lose money when trading CFDs with this provider. You should consider whether you understand how CFDs work and whether you can afford to take the high risk of losing all your money. Read full risk warning.
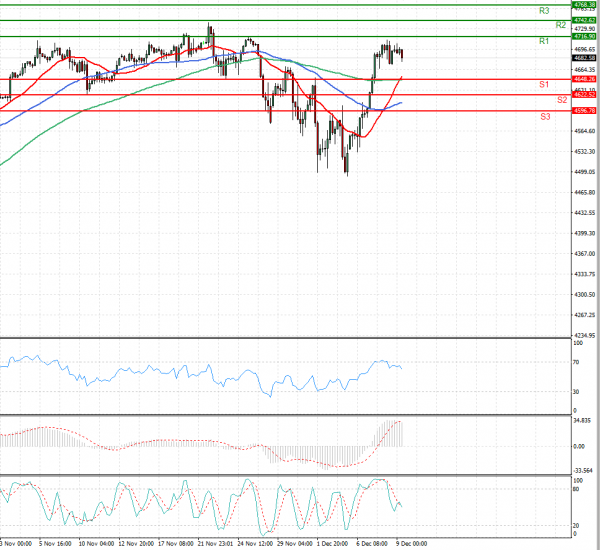
US Session Analysis for CFD Instruments 09/12/2021
Fundamental analysis
09 December, 2021
U.S. stock futures edged down as investors assessed the latest headlines on restrictions to limit the spread of the Omicron variant. Futures tied to the S&P 500 retreated 0.3% Thursday, suggesting the broad-market index is set to pull back moderately after closing up 0.3% Wednesday. Dow Jones Industrial Average futures also slid 0.3% and Nasdaq-100 futures ticked down 0.2%. Stocks have swung in recent weeks, buffeted by conflicting headlines on the Omicron coronavirus variant and mixed signals on the health of the economy. Investors are still awaiting further data on the strain’s severity and vaccine efficacy. Some pharmaceutical companies including Pfizer and GlaxoSmithKline have said this week that their shot and antibody treatment appear to work in early-stage studies.