Fortrade Canada Ltd. as an order-execution only dealer is not permitted to provide you with any advice or recommendations. These Market Commentaries should not be construed as a recommendation, advice or any attempt by Fortrade Canada Ltd. to prompt or influence you in making an investment decision to purchase, sell, hold or exchange any security or to influence the timing of such activity. This content is produced by Fortrade Limited which is not registered in any capacity with any securities regulatory authority in Canada.
69% of retail investor accounts lose money when trading CFDs with this provider.
CFDs are complex instruments and come with a high risk of losing money rapidly due to leverage. 69% of retail investor accounts lose money when trading CFDs with this provider. You should consider whether you understand how CFDs work and whether you can afford to take the high risk of losing your money.
67.52% of retail investor accounts lose money when trading CFDs with this provider.
CFDs are complex instruments and come with a high risk of losing money rapidly due to leverage. 67.52% of retail investor accounts lose money when trading CFDs with this provider. You should consider whether you understand how CFDs work and whether you can afford to take the high risk of losing all your money. Read full risk warning.
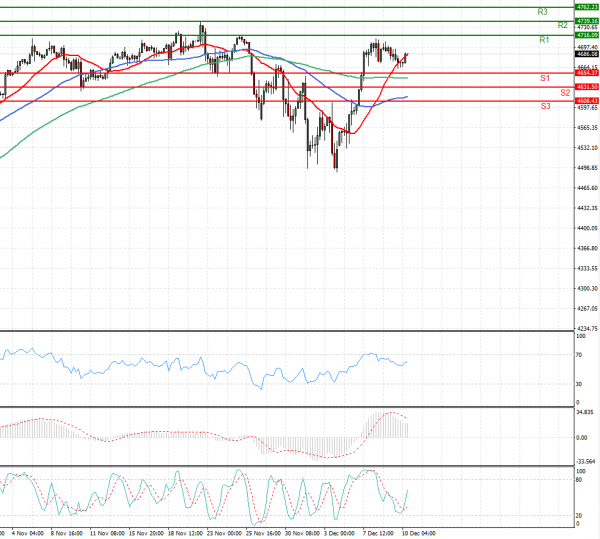
US Session Analysis for CFD Instruments 10/12/2021
Fundamental analysis
10 December, 2021
U.S. stock futures and bond yields rose ahead of fresh inflation data that could influence the Federal Reserve’s timeline for reducing stimulus measures. Futures for the S&P 500 gained 0.3% Friday. The index retreated Thursday but was on track for its strongest week of gains since February. Contracts for the tech-focused Nasdaq-100 rose 0.3% Friday, and futures for the Dow Jones Industrial Average were up 0.1%. Economists surveyed by The Wall Street Journal expect that U.S. inflation hit an almost four-decade high in November. Price pressures have been driven by strong demand and supply-chain woes related to the pandemic, as well as higher energy prices. The Federal Reserve will hold a two-meeting meeting next week at which it may provide more details about how it plans to wind down its bond-buying program and when it plans to begin raising interest rates. Investors are waiting to see whether officials signal a faster end to stimulus than currently expected and how they characterize inflation.