Fortrade Canada Ltd. as an order-execution only dealer is not permitted to provide you with any advice or recommendations. These Market Commentaries should not be construed as a recommendation, advice or any attempt by Fortrade Canada Ltd. to prompt or influence you in making an investment decision to purchase, sell, hold or exchange any security or to influence the timing of such activity. This content is produced by Fortrade Limited which is not registered in any capacity with any securities regulatory authority in Canada.
69% of retail investor accounts lose money when trading CFDs with this provider.
CFDs are complex instruments and come with a high risk of losing money rapidly due to leverage. 69% of retail investor accounts lose money when trading CFDs with this provider. You should consider whether you understand how CFDs work and whether you can afford to take the high risk of losing your money.
67.52% of retail investor accounts lose money when trading CFDs with this provider.
CFDs are complex instruments and come with a high risk of losing money rapidly due to leverage. 67.52% of retail investor accounts lose money when trading CFDs with this provider. You should consider whether you understand how CFDs work and whether you can afford to take the high risk of losing all your money. Read full risk warning.
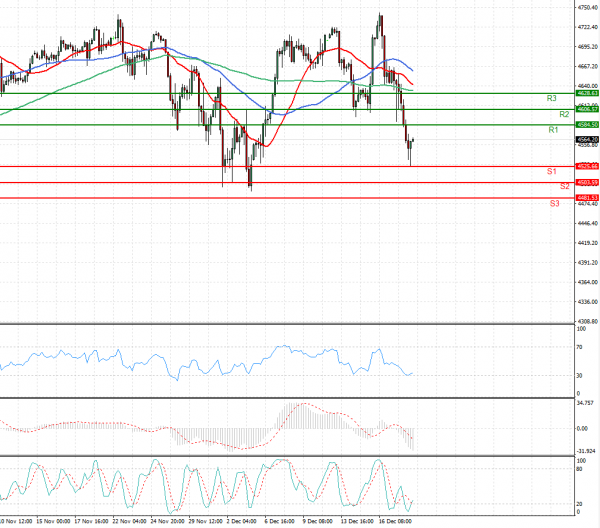
US Session Analysis for CFD Instruments 20/12/2021
Fundamental analysis
20 December, 2021
U.S. stock futures, oil prices and bond yields fell as investors worried that a rise in Omicron Covid-19 cases would stall economic growth and add pressure to inflation. Futures for the S&P 500 tumbled 1.8% Monday. The index fell Friday, notching its largest weekly percentage decline in three weeks. Contracts for the tech-focused Nasdaq-100 shed 1.7% Monday, and futures for the Dow Jones Industrial Average declined 1.7%. Some countries are imposing restrictions to stem the spread of the Omicron variant as the holiday season starts. The Netherlands on Sunday reimposed a lockdown, with all nonessential shops, bars and restaurants closed until mid-January. Irish Prime Minister Micheál Martin also announced new restrictions. President Biden plans to deliver an update Tuesday on the fight against Covid-19 in the U.S., where cases are rising. The rise in infections has prompted concerns that a new wave is likely to prolong supply-chain disruptions that have elevated inflation.