Fortrade Canada Ltd. as an order-execution only dealer is not permitted to provide you with any advice or recommendations. These Market Commentaries should not be construed as a recommendation, advice or any attempt by Fortrade Canada Ltd. to prompt or influence you in making an investment decision to purchase, sell, hold or exchange any security or to influence the timing of such activity. This content is produced by Fortrade Limited which is not registered in any capacity with any securities regulatory authority in Canada.
71% of retail investor accounts lose money when trading CFDs with this provider.
CFDs are complex instruments and come with a high risk of losing money rapidly due to leverage. 71% of retail investor accounts lose money when trading CFDs with this provider. You should consider whether you understand how CFDs work and whether you can afford to take the high risk of losing your money.
70.41% of retail investor accounts lose money when trading CFDs with this provider.
CFDs are complex instruments and come with a high risk of losing money rapidly due to leverage. 70.41% of retail investor accounts lose money when trading CFDs with this provider. You should consider whether you understand how CFDs work and whether you can afford to take the high risk of losing all your money. Read full risk warning.
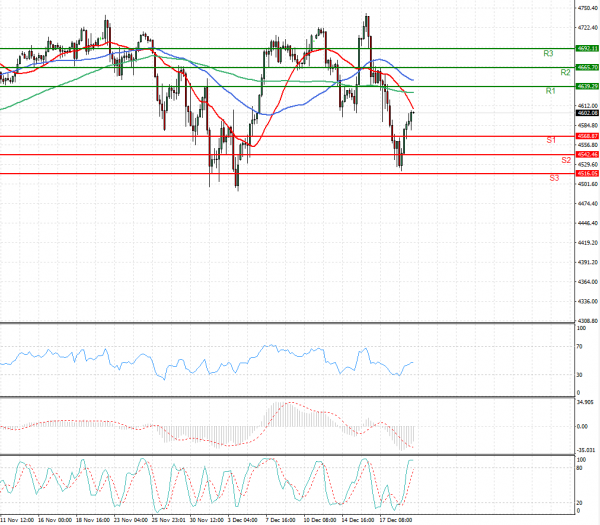
US Session Analysis for CFD Instruments 21/12/2021
Fundamental analysis
21 December, 2021
U.S. stock futures rose, resuming the seesaw action that has become the signature of markets since the emergence of the Omicron Covid-19 variant. Futures for the S&P 500 advanced 0.5% Tuesday. The index declined for the third consecutive trading session Monday, as the fast-spreading Omicron variant spurred fears that new lockdowns could derail the sputtering global economic recovery. Contracts for the tech-focused Nasdaq-100 rose 0.7% Tuesday, and futures for the Dow Jones Industrial Average were up 0.5%. Investors have grappled with a mix of concerns heading into the end of the year. The rise in Omicron cases has spurred concerns about global growth and whether it will prolong the global supply-chain disruptions that have added to inflation. However, signs that vaccine boosters offer protection against Omicron have bolstered hopes that its impact on growth can be mitigated.