Fortrade Canada Ltd. as an order-execution only dealer is not permitted to provide you with any advice or recommendations. These Market Commentaries should not be construed as a recommendation, advice or any attempt by Fortrade Canada Ltd. to prompt or influence you in making an investment decision to purchase, sell, hold or exchange any security or to influence the timing of such activity. This content is produced by Fortrade Limited which is not registered in any capacity with any securities regulatory authority in Canada.
70% of retail investor accounts lose money when trading CFDs with this provider.
CFDs are complex instruments and come with a high risk of losing money rapidly due to leverage. 70% of retail investor accounts lose money when trading CFDs with this provider. You should consider whether you understand how CFDs work and whether you can afford to take the high risk of losing your money.
70.41% of retail investor accounts lose money when trading CFDs with this provider.
CFDs are complex instruments and come with a high risk of losing money rapidly due to leverage. 70.41% of retail investor accounts lose money when trading CFDs with this provider. You should consider whether you understand how CFDs work and whether you can afford to take the high risk of losing all your money. Read full risk warning.
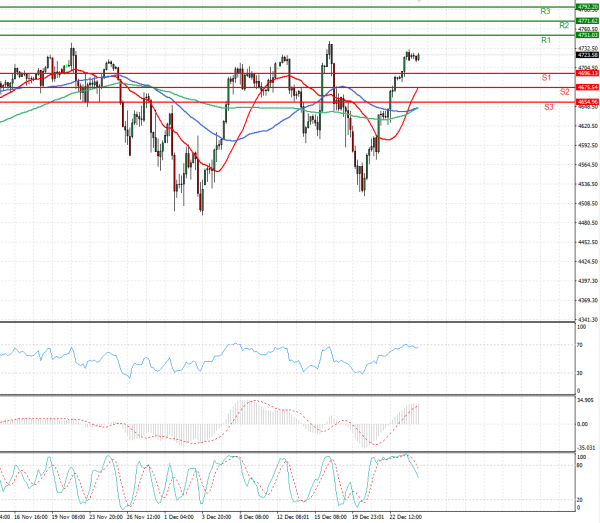
US Session Analysis for CFD Instruments 27/12/2021
Fundamental analysis
27 December, 2021
U.S. stock futures were muted, with little news driving markets after the Christmas holiday. Futures for the S&P 500 were flat Monday. The index hit its 68th record close of 2021 Thursday. U.S. markets were closed Friday for the holiday. Contracts for the tech-focused Nasdaq-100 edged up less than 0.1% Monday, and futures for the Dow Jones Industrial Average ticked down 0.1%. Investors are braced for higher volatility over the holiday season. Concerns over the rapid spread of the Omicron variant of Covid-19 and the economic impact of measures countries may take to stem its spread have weighed on markets in recent weeks. Some investors expect that will be mitigated by vaccines and the rollout of booster shots in some nations.