Fortrade Canada Ltd. as an order-execution only dealer is not permitted to provide you with any advice or recommendations. These Market Commentaries should not be construed as a recommendation, advice or any attempt by Fortrade Canada Ltd. to prompt or influence you in making an investment decision to purchase, sell, hold or exchange any security or to influence the timing of such activity. This content is produced by Fortrade Limited which is not registered in any capacity with any securities regulatory authority in Canada.
71% of retail investor accounts lose money when trading CFDs with this provider.
CFDs are complex instruments and come with a high risk of losing money rapidly due to leverage. 71% of retail investor accounts lose money when trading CFDs with this provider. You should consider whether you understand how CFDs work and whether you can afford to take the high risk of losing your money.
70.41% of retail investor accounts lose money when trading CFDs with this provider.
CFDs are complex instruments and come with a high risk of losing money rapidly due to leverage. 70.41% of retail investor accounts lose money when trading CFDs with this provider. You should consider whether you understand how CFDs work and whether you can afford to take the high risk of losing all your money. Read full risk warning.
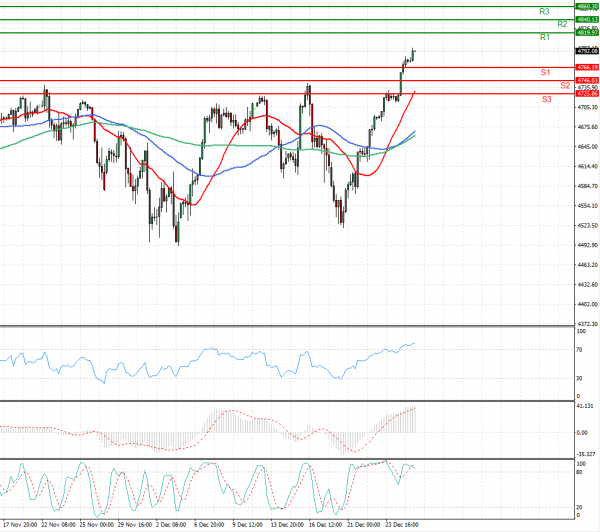
US Session Analysis for CFD Instruments 28/12/2021
Fundamental analysis
28 December, 2021
U.S. stock futures edged higher Tuesday, a day after a record close for the S&P 500 amid lower liquidity in the last days of the year. Futures tied to the S&P 500 added 0.3% after the broad-market index rallied 1.4% on Monday. Nasdaq-100 futures rose 0.5%, pointing to gains in technology stocks after the opening bell. Dow Jones Industrial Average futures ticked up 0.2%. Stocks have been buffeted by the spread of the Omicron variant in recent weeks as governments around the world have imposed restrictions to try to curb infections. But some recent studies have suggested that the variant might result in milder illness with lower risk of hospitalization. The Centers for Disease Control and Prevention reduced the recommended isolation period for some people who test positive to try to minimize disruptions. Still, many economists have lowered their forecasts for economic growth in the first quarter of next year.