Fortrade Canada Ltd. as an order-execution only dealer is not permitted to provide you with any advice or recommendations. These Market Commentaries should not be construed as a recommendation, advice or any attempt by Fortrade Canada Ltd. to prompt or influence you in making an investment decision to purchase, sell, hold or exchange any security or to influence the timing of such activity. This content is produced by Fortrade Limited which is not registered in any capacity with any securities regulatory authority in Canada.
69% of retail investor accounts lose money when trading CFDs with this provider.
CFDs are complex instruments and come with a high risk of losing money rapidly due to leverage. 69% of retail investor accounts lose money when trading CFDs with this provider. You should consider whether you understand how CFDs work and whether you can afford to take the high risk of losing your money.
67.52% of retail investor accounts lose money when trading CFDs with this provider.
CFDs are complex instruments and come with a high risk of losing money rapidly due to leverage. 67.52% of retail investor accounts lose money when trading CFDs with this provider. You should consider whether you understand how CFDs work and whether you can afford to take the high risk of losing all your money. Read full risk warning.
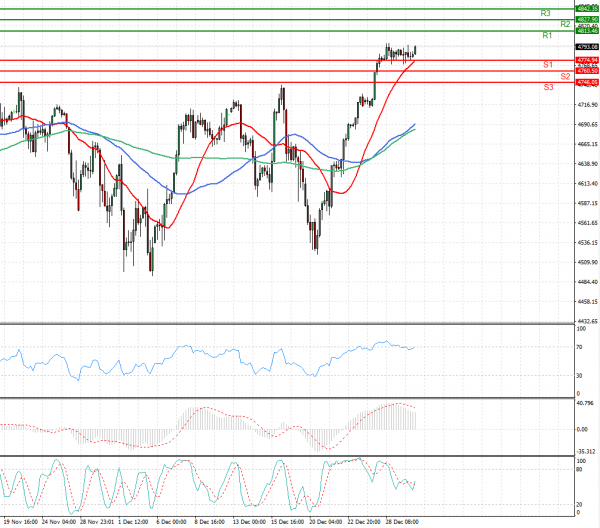
US Session Analysis for CFD Instruments 30/12/2021
Fundamental analysis
30 December, 2021
U.S. stock futures held steady as investors awaited data that will give an indication of whether the recent uptick in Covid-19 infections is hurting the labor market. U.S. stocks are racing toward a third consecutive year of big gains, with major indexes near records to end 2021. Even with the recent turbulence from the Omicron coronavirus variant, the S&P 500 is headed toward a 28% advance for 2021 and has hit 70 highs. It is the third straight year of double-digit gains for the broad index, and the second in the midst of the Covid-19 pandemic. Stocks typically rise during the last five trading days of the year and the first two trading days of the new year—a phenomenon known as the “Santa Claus rally.” Since 1950, the S&P 500 has ended higher about 77% of the time during the period, according to Dow Jones Market Data, with an average gain of 1.3%.