Fortrade Canada Ltd. as an order-execution only dealer is not permitted to provide you with any advice or recommendations. These Market Commentaries should not be construed as a recommendation, advice or any attempt by Fortrade Canada Ltd. to prompt or influence you in making an investment decision to purchase, sell, hold or exchange any security or to influence the timing of such activity. This content is produced by Fortrade Limited which is not registered in any capacity with any securities regulatory authority in Canada.
71% of retail investor accounts lose money when trading CFDs with this provider.
CFDs are complex instruments and come with a high risk of losing money rapidly due to leverage. 71% of retail investor accounts lose money when trading CFDs with this provider. You should consider whether you understand how CFDs work and whether you can afford to take the high risk of losing your money.
70.41% of retail investor accounts lose money when trading CFDs with this provider.
CFDs are complex instruments and come with a high risk of losing money rapidly due to leverage. 70.41% of retail investor accounts lose money when trading CFDs with this provider. You should consider whether you understand how CFDs work and whether you can afford to take the high risk of losing all your money. Read full risk warning.
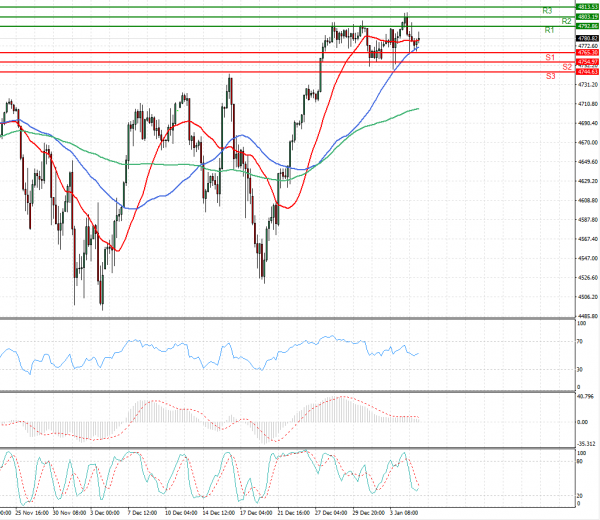
US Session Analysis for CFD Instruments 05/01/2022
Fundamental analysis
05 January, 2022
U.S. stock futures wobbled as investors awaited minutes from the Federal Reserve’s recent policy meeting in the hope of gleaning fresh clues about plans to wean markets off pandemic-era stimulus measures. Futures tied to the S&P 500 flicked between small gains and losses Wednesday, a day after the broad index pulled from a record high as technology firms fell. Futures for the tech-heavy Nasdaq-100 fell 0.3% Wednesday, while blue-chip Dow Jones Industrial Average futures were unchanged. Markets have largely begun 2022 on a strong footing, lifted by easing concerns about the Omicron Covid-19 variant. Signs that the variant is less likely to cause severe disease means investors are betting it won’t derail strong growth for the economy and corporate earnings.