Fortrade Canada Ltd. as an order-execution only dealer is not permitted to provide you with any advice or recommendations. These Market Commentaries should not be construed as a recommendation, advice or any attempt by Fortrade Canada Ltd. to prompt or influence you in making an investment decision to purchase, sell, hold or exchange any security or to influence the timing of such activity. This content is produced by Fortrade Limited which is not registered in any capacity with any securities regulatory authority in Canada.
69% of retail investor accounts lose money when trading CFDs with this provider.
CFDs are complex instruments and come with a high risk of losing money rapidly due to leverage. 69% of retail investor accounts lose money when trading CFDs with this provider. You should consider whether you understand how CFDs work and whether you can afford to take the high risk of losing your money.
70.88% of retail investor accounts lose money when trading CFDs with this provider.
CFDs are complex instruments and come with a high risk of losing money rapidly due to leverage. 70.88% of retail investor accounts lose money when trading CFDs with this provider. You should consider whether you understand how CFDs work and whether you can afford to take the high risk of losing all your money. Read full risk warning.
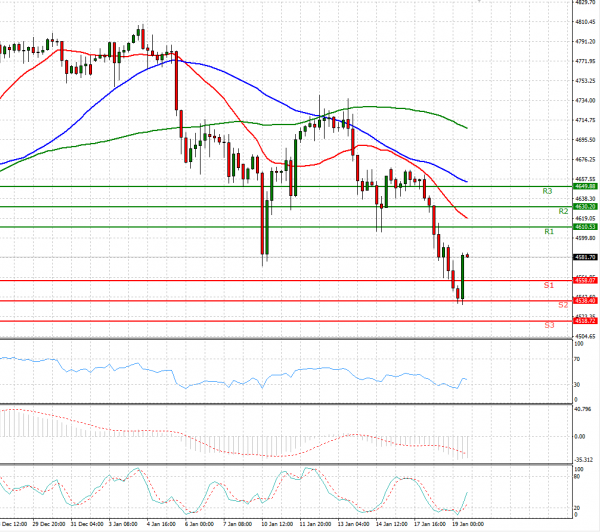
US Session Analysis for CFD Instruments 19/01/2022
Fundamental analysis
19 January, 2022
U.S. stocks were poised for muted opening moves following Tuesday’s selloff, and government-bond yields extended their advance, as investors prepare for central banks globally to raise interest rates. Futures for the S&P 500 fell 0.1% Wednesday. The benchmark gauge lost 1.8% on Tuesday, its second decline in three trading days, under pressure from stocks including Goldman Sachs Group and Moderna. Contracts for the technology-heavy Nasdaq-100 were flat Wednesday and Dow Jones Industrial Average futures slipped 0.1%. Investors kept selling government bonds, pushing up yields. Yields on benchmark 10-year Treasury notes rose to 1.893%, compared with 1.866% Tuesday, which was their highest level since January 2020. Yields on interest rate-sensitive two-year notes rose to 1.063% from 1.038% Tuesday.