Fortrade Canada Ltd. as an order-execution only dealer is not permitted to provide you with any advice or recommendations. These Market Commentaries should not be construed as a recommendation, advice or any attempt by Fortrade Canada Ltd. to prompt or influence you in making an investment decision to purchase, sell, hold or exchange any security or to influence the timing of such activity. This content is produced by Fortrade Limited which is not registered in any capacity with any securities regulatory authority in Canada.
71% of retail investor accounts lose money when trading CFDs with this provider.
CFDs are complex instruments and come with a high risk of losing money rapidly due to leverage. 71% of retail investor accounts lose money when trading CFDs with this provider. You should consider whether you understand how CFDs work and whether you can afford to take the high risk of losing your money.
70.91% of retail investor accounts lose money when trading CFDs with this provider.
CFDs are complex instruments and come with a high risk of losing money rapidly due to leverage. 70.91% of retail investor accounts lose money when trading CFDs with this provider. You should consider whether you understand how CFDs work and whether you can afford to take the high risk of losing all your money. Read full risk warning.
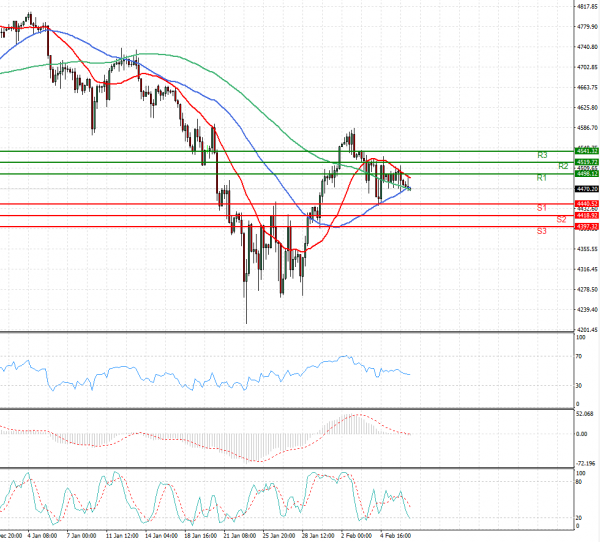
US Session Analysis for CFD Instruments 08/02/2022
Fundamental analysis
08 February, 2022
U.S. stock futures edged up and Treasury yields gained as investors awaited another docket of major earnings and data on the trade deficit. Futures tied to the S&P 500 edged up 0.2% Tuesday, after the broad index closed lower following another volatile trading day. Blue-chip Dow Jones Industrial Average Futures gained 0.3%, while futures for the technology-heavy Nasdaq-100 rose 0.2%. Markets have been roiled by volatile trading in recent sessions, prompted in part by expectations of higher rates. The Fed’s expected tightening comes against a backdrop of moderating growth and investors have been reassessing which companies are best placed to weather the more challenging outlook.