Fortrade Canada Ltd. as an order-execution only dealer is not permitted to provide you with any advice or recommendations. These Market Commentaries should not be construed as a recommendation, advice or any attempt by Fortrade Canada Ltd. to prompt or influence you in making an investment decision to purchase, sell, hold or exchange any security or to influence the timing of such activity. This content is produced by Fortrade Limited which is not registered in any capacity with any securities regulatory authority in Canada.
66% of retail investor accounts lose money when trading CFDs with this provider.
CFDs are complex instruments and come with a high risk of losing money rapidly due to leverage. 66% of retail investor accounts lose money when trading CFDs with this provider. You should consider whether you understand how CFDs work and whether you can afford to take the high risk of losing your money.
70.91% of retail investor accounts lose money when trading CFDs with this provider.
CFDs are complex instruments and come with a high risk of losing money rapidly due to leverage. 70.91% of retail investor accounts lose money when trading CFDs with this provider. You should consider whether you understand how CFDs work and whether you can afford to take the high risk of losing all your money. Read full risk warning.
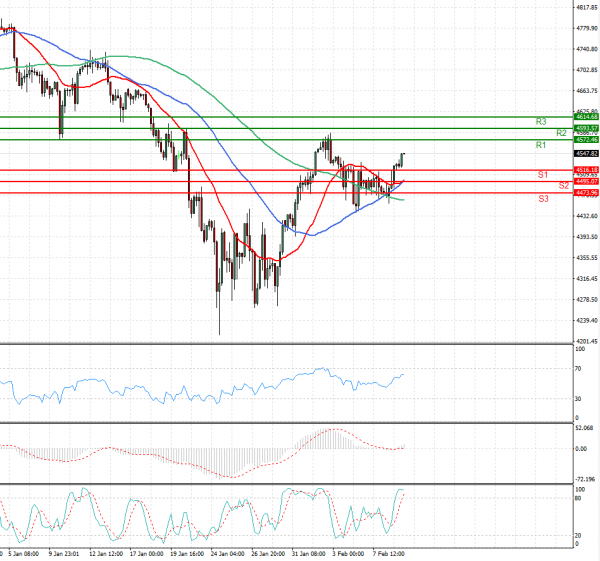
US Session Analysis for CFD Instruments 09/02/2022
Fundamental analysis
09 February, 2022
U.S. stock futures rose and government bond yields fell following a recent climb, potentially easing some pressure on technology shares. Futures for the S&P 500 added 0.7% Wednesday. The broad-market index rose Tuesday as investors snapped up shares of companies across industries. Contracts for the tech-focused Nasdaq-100 gained almost 1% and futures for the Dow Jones Industrial Average rose 0.5% Wednesday. Shares of Netflix added 1.6% premarket, while Alphabet gained 1.2% as bond yields ticked lower. Technology companies tend to benefit from low yields as some investors will pay more for shares that they expect to churn out outsize profits in the future. This reverses when yields rise.