Fortrade Canada Ltd. as an order-execution only dealer is not permitted to provide you with any advice or recommendations. These Market Commentaries should not be construed as a recommendation, advice or any attempt by Fortrade Canada Ltd. to prompt or influence you in making an investment decision to purchase, sell, hold or exchange any security or to influence the timing of such activity. This content is produced by Fortrade Limited which is not registered in any capacity with any securities regulatory authority in Canada.
71% of retail investor accounts lose money when trading CFDs with this provider.
CFDs are complex instruments and come with a high risk of losing money rapidly due to leverage. 71% of retail investor accounts lose money when trading CFDs with this provider. You should consider whether you understand how CFDs work and whether you can afford to take the high risk of losing your money.
70.91% of retail investor accounts lose money when trading CFDs with this provider.
CFDs are complex instruments and come with a high risk of losing money rapidly due to leverage. 70.91% of retail investor accounts lose money when trading CFDs with this provider. You should consider whether you understand how CFDs work and whether you can afford to take the high risk of losing all your money. Read full risk warning.
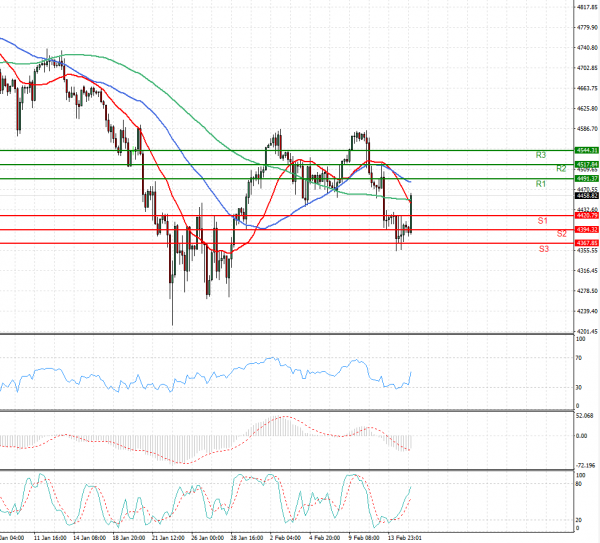
US Session Analysis for CFD Instruments 15/02/2022
Fundamental analysis
15 February, 2022
U.S. stock futures and European indexes rallied, following days of losses, while energy prices slumped and bonds sold-off, after reports that Russia was pulling back some troops from the Ukrainian border.Futures tied to the S&P 500 rose 1.3% Tuesday, putting the broad index on course to halt three days of losses after the opening bell. Yields on benchmark U.S. 10-year Treasury notes rallied to 2.035% from 1.995% Monday. Bond yields and prices move in opposite directions. The threat of war between Ukraine and Russia has, in recent days, added a geopolitical element to investors’ already troubled outlook. Warnings from the U.S. and its allies about the likelihood of a Russian invasion have grown louder, spooking investors concerned about the economic hit from such a conflict or the resulting sanctions on Russia’s economy.