Fortrade Canada Ltd. as an order-execution only dealer is not permitted to provide you with any advice or recommendations. These Market Commentaries should not be construed as a recommendation, advice or any attempt by Fortrade Canada Ltd. to prompt or influence you in making an investment decision to purchase, sell, hold or exchange any security or to influence the timing of such activity. This content is produced by Fortrade Limited which is not registered in any capacity with any securities regulatory authority in Canada.
71% of retail investor accounts lose money when trading CFDs with this provider.
CFDs are complex instruments and come with a high risk of losing money rapidly due to leverage. 71% of retail investor accounts lose money when trading CFDs with this provider. You should consider whether you understand how CFDs work and whether you can afford to take the high risk of losing your money.
70.91% of retail investor accounts lose money when trading CFDs with this provider.
CFDs are complex instruments and come with a high risk of losing money rapidly due to leverage. 70.91% of retail investor accounts lose money when trading CFDs with this provider. You should consider whether you understand how CFDs work and whether you can afford to take the high risk of losing all your money. Read full risk warning.
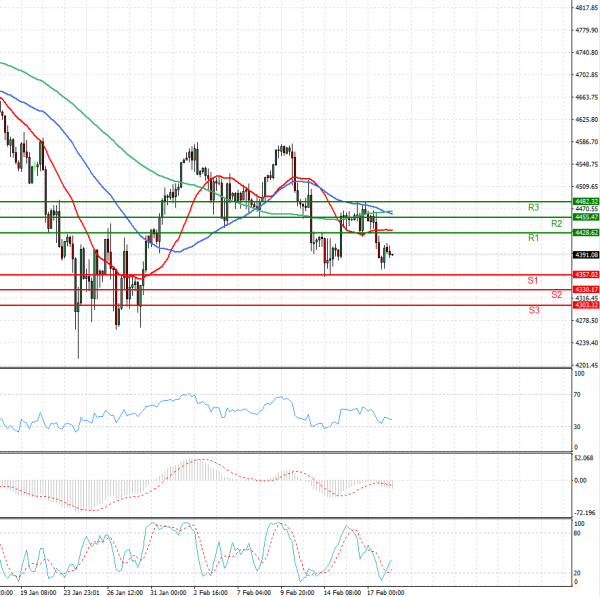
US Session Analysis for CFD Instruments 18/02/2022
Fundamental analysis
18 February, 2022
Stock futures gained after the Dow Jones Industrial Average suffered its steepest one-day loss of 2022, as investors tracked the escalating violence in Ukraine and considered the potential path of U.S. monetary policy. Futures for the S&P 500 gained 0.4% Friday, at the end of a turbulent week for markets. Contracts for the tech-focused Nasdaq-100 added 0.5% and futures for the Dow Jones Industrial Average rose 0.4%. Stocks slid Thursday, with the Dow dropping more than 600 points, its steepest one-day loss of 2022.All three major stock indexes were on track to notch weekly losses as of Thursday’s close. Investors have struggled with mixed messages on the potential for escalation between Russia and Ukraine. Secretary of State Antony Blinken warned Thursday of a looming Russian offensive against Ukraine and proposed a last-ditch diplomatic meeting with his Russian counterpart.