Fortrade Canada Ltd. as an order-execution only dealer is not permitted to provide you with any advice or recommendations. These Market Commentaries should not be construed as a recommendation, advice or any attempt by Fortrade Canada Ltd. to prompt or influence you in making an investment decision to purchase, sell, hold or exchange any security or to influence the timing of such activity. This content is produced by Fortrade Limited which is not registered in any capacity with any securities regulatory authority in Canada.
71% of retail investor accounts lose money when trading CFDs with this provider.
CFDs are complex instruments and come with a high risk of losing money rapidly due to leverage. 71% of retail investor accounts lose money when trading CFDs with this provider. You should consider whether you understand how CFDs work and whether you can afford to take the high risk of losing your money.
70.91% of retail investor accounts lose money when trading CFDs with this provider.
CFDs are complex instruments and come with a high risk of losing money rapidly due to leverage. 70.91% of retail investor accounts lose money when trading CFDs with this provider. You should consider whether you understand how CFDs work and whether you can afford to take the high risk of losing all your money. Read full risk warning.
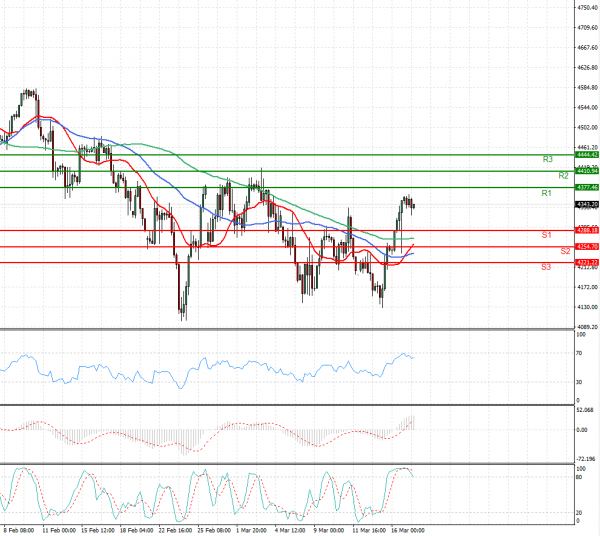
US Session Analysis for CFD Instruments 17/03/2022
Fundamental analysis
17 March, 2022
U.S. stock futures edged down and government bonds took a breather after the Federal Reserve raised interest rates for the first time since 2018, and as Chinese shares extended a robust rebound. Futures tied to the S&P 500 declined 0.3%, pointing to a decline in the broad-market index after it closed more than 2% higher on the past two consecutive days. Nasdaq-100 futures fell 0.4%, suggesting moderate losses for technology stocks after the opening bell. Fed officials penciled in six more interest-rate increases by year’s end, as the central bank moved more aggressively to slow inflation, which is running at a four-decade high.