Fortrade Canada Ltd. as an order-execution only dealer is not permitted to provide you with any advice or recommendations. These Market Commentaries should not be construed as a recommendation, advice or any attempt by Fortrade Canada Ltd. to prompt or influence you in making an investment decision to purchase, sell, hold or exchange any security or to influence the timing of such activity. This content is produced by Fortrade Limited which is not registered in any capacity with any securities regulatory authority in Canada.
69% of retail investor accounts lose money when trading CFDs with this provider.
CFDs are complex instruments and come with a high risk of losing money rapidly due to leverage. 69% of retail investor accounts lose money when trading CFDs with this provider. You should consider whether you understand how CFDs work and whether you can afford to take the high risk of losing your money.
67.52% of retail investor accounts lose money when trading CFDs with this provider.
CFDs are complex instruments and come with a high risk of losing money rapidly due to leverage. 67.52% of retail investor accounts lose money when trading CFDs with this provider. You should consider whether you understand how CFDs work and whether you can afford to take the high risk of losing all your money. Read full risk warning.
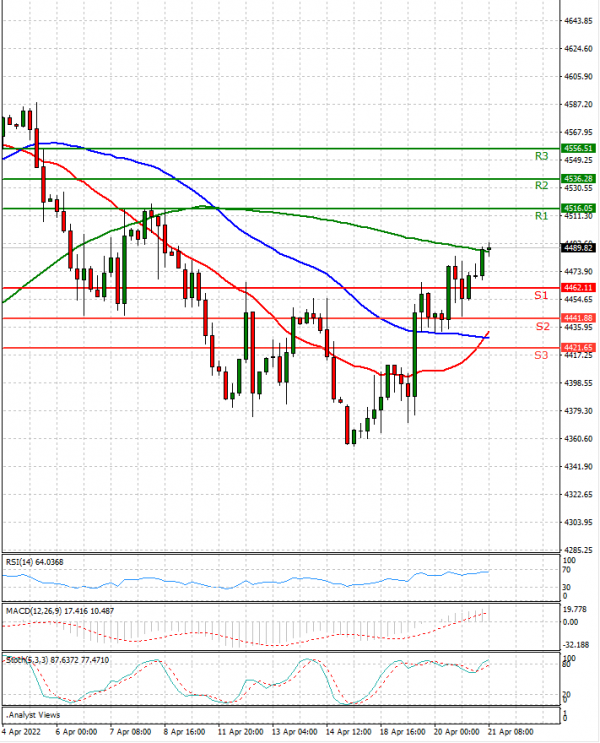
US Session Analysis for CFD Instruments 21/04/2022
Fundamental analysis
21 April, 2022
Stock futures rose as investors awaited comments from Federal Reserve Chairman Jerome Powell on the world economy and earnings from major American companies. Futures for the Nasdaq-100 index added 1.2%, pointing to gains for technology stocks after a plunge in Netflix shares weighed on the sector Wednesday. S&P 500 futures rose 0.8% and contracts for the Dow Jones Industrial Average edged up 0.6%. Ahead of the bell, shares of Tesla rose 7.2%. The electric-vehicle maker reported $3.3 billion in quarterly profits late Wednesday, its highest profit to date. Investors said broader markets were in a holding pattern before Mr. Powell’s appearance at a debate on the global economy, hosted by the International Monetary Fund and scheduled to start at 1 p.m.