Fortrade Canada Ltd. as an order-execution only dealer is not permitted to provide you with any advice or recommendations. These Market Commentaries should not be construed as a recommendation, advice or any attempt by Fortrade Canada Ltd. to prompt or influence you in making an investment decision to purchase, sell, hold or exchange any security or to influence the timing of such activity. This content is produced by Fortrade Limited which is not registered in any capacity with any securities regulatory authority in Canada.
69% of retail investor accounts lose money when trading CFDs with this provider.
CFDs are complex instruments and come with a high risk of losing money rapidly due to leverage. 69% of retail investor accounts lose money when trading CFDs with this provider. You should consider whether you understand how CFDs work and whether you can afford to take the high risk of losing your money.
67.52% of retail investor accounts lose money when trading CFDs with this provider.
CFDs are complex instruments and come with a high risk of losing money rapidly due to leverage. 67.52% of retail investor accounts lose money when trading CFDs with this provider. You should consider whether you understand how CFDs work and whether you can afford to take the high risk of losing all your money. Read full risk warning.
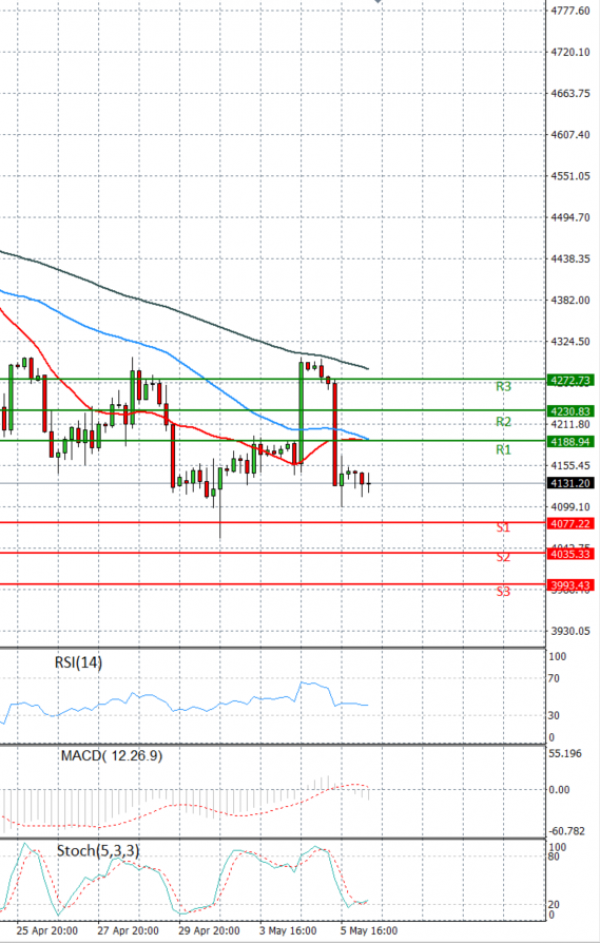
US Session Analysis for CFD Instruments 06/05/2022
Fundamental analysis
06 May, 2022
U.S. stock futures slipped, putting major indexes on track to extend losses after one of Wall Street’s worst selloffs since the pandemic began. Futures tied to the Dow Jones Industrial Average shed 0.4%, a day after the blue-chip index slumped more than 1,000 points, its worst day since 2020. S&P 500 futures edged down 0.3% while technology-heavy Nasdaq-100 futures were down 0.3%. Stocks have been whipsawed in recent days as investors have tried to gauge what impact the Federal Reserve’s plan to raise interest rates will have on the economy. Investors are caught between competing hopes: that rate increases will be significant enough to tame rapidly rising inflation, but not so large that they will derail economic growth.