Fortrade Canada Ltd. as an order-execution only dealer is not permitted to provide you with any advice or recommendations. These Market Commentaries should not be construed as a recommendation, advice or any attempt by Fortrade Canada Ltd. to prompt or influence you in making an investment decision to purchase, sell, hold or exchange any security or to influence the timing of such activity. This content is produced by Fortrade Limited which is not registered in any capacity with any securities regulatory authority in Canada.
69% of retail investor accounts lose money when trading CFDs with this provider.
CFDs are complex instruments and come with a high risk of losing money rapidly due to leverage. 69% of retail investor accounts lose money when trading CFDs with this provider. You should consider whether you understand how CFDs work and whether you can afford to take the high risk of losing your money.
67.52% of retail investor accounts lose money when trading CFDs with this provider.
CFDs are complex instruments and come with a high risk of losing money rapidly due to leverage. 67.52% of retail investor accounts lose money when trading CFDs with this provider. You should consider whether you understand how CFDs work and whether you can afford to take the high risk of losing all your money. Read full risk warning.
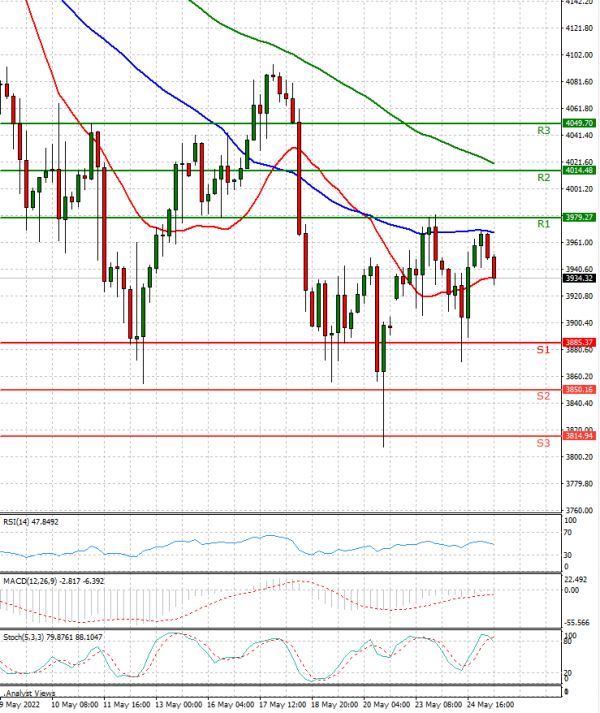
US Session Analysis for CFD Instruments 25/05/2022
Fundamental analysis
25 May, 2022
U.S. stock futures were little changed ahead of the release of minutes from the Federal Reserve’s most recent policy meeting, which will be combed for details on the path of coming interest-rate rises. Futures tied to the S&P 500 were flat after the broad-market index closed down 0.8% on Tuesday. Stocks have had a volatile start to the week, buffeted by concerns about the Federal Reserve tightening monetary policy to combat the bout of high inflation and how sharp of a slowdown in growth it could cause. The S&P 500 is down nearly 18% from its last record high in January and briefly fell into a bear market last Friday before paring losses.