Fortrade Canada Ltd. as an order-execution only dealer is not permitted to provide you with any advice or recommendations. These Market Commentaries should not be construed as a recommendation, advice or any attempt by Fortrade Canada Ltd. to prompt or influence you in making an investment decision to purchase, sell, hold or exchange any security or to influence the timing of such activity. This content is produced by Fortrade Limited which is not registered in any capacity with any securities regulatory authority in Canada.
69% of retail investor accounts lose money when trading CFDs with this provider.
CFDs are complex instruments and come with a high risk of losing money rapidly due to leverage. 69% of retail investor accounts lose money when trading CFDs with this provider. You should consider whether you understand how CFDs work and whether you can afford to take the high risk of losing your money.
67.52% of retail investor accounts lose money when trading CFDs with this provider.
CFDs are complex instruments and come with a high risk of losing money rapidly due to leverage. 67.52% of retail investor accounts lose money when trading CFDs with this provider. You should consider whether you understand how CFDs work and whether you can afford to take the high risk of losing all your money. Read full risk warning.
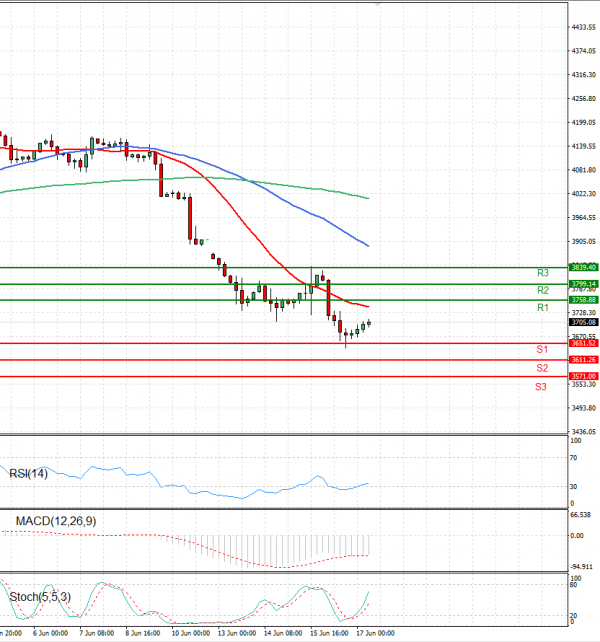
US Session Analysis for CFD Instruments 17/06/2022
Fundamental analysis
17 June, 2022
U.S. stock futures advanced, putting major indexes on course to extend the whipsaw moves that have injected fresh volatility into markets this week. Futures for the S&P 500 added 0.7% Friday. All three major indexes fell Thursday, closing at their lowest levels since 2020. Thursday’s decline reversed a rally in stocks Wednesday. Stock indexes are on track to finish the week with sharp losses as investors have tried to assess inflation, central banks’ response to it and the outlook for the global economy. The Federal Reserve earlier this week approved the largest interest-rate increase since 1994 and signaled it would continue lifting rates this year at the most rapid pace in decades to fight inflation.