Fortrade Canada Ltd. as an order-execution only dealer is not permitted to provide you with any advice or recommendations. These Market Commentaries should not be construed as a recommendation, advice or any attempt by Fortrade Canada Ltd. to prompt or influence you in making an investment decision to purchase, sell, hold or exchange any security or to influence the timing of such activity. This content is produced by Fortrade Limited which is not registered in any capacity with any securities regulatory authority in Canada.
71% of retail investor accounts lose money when trading CFDs with this provider.
CFDs are complex instruments and come with a high risk of losing money rapidly due to leverage. 71% of retail investor accounts lose money when trading CFDs with this provider. You should consider whether you understand how CFDs work and whether you can afford to take the high risk of losing your money.
70.91% of retail investor accounts lose money when trading CFDs with this provider.
CFDs are complex instruments and come with a high risk of losing money rapidly due to leverage. 70.91% of retail investor accounts lose money when trading CFDs with this provider. You should consider whether you understand how CFDs work and whether you can afford to take the high risk of losing all your money. Read full risk warning.
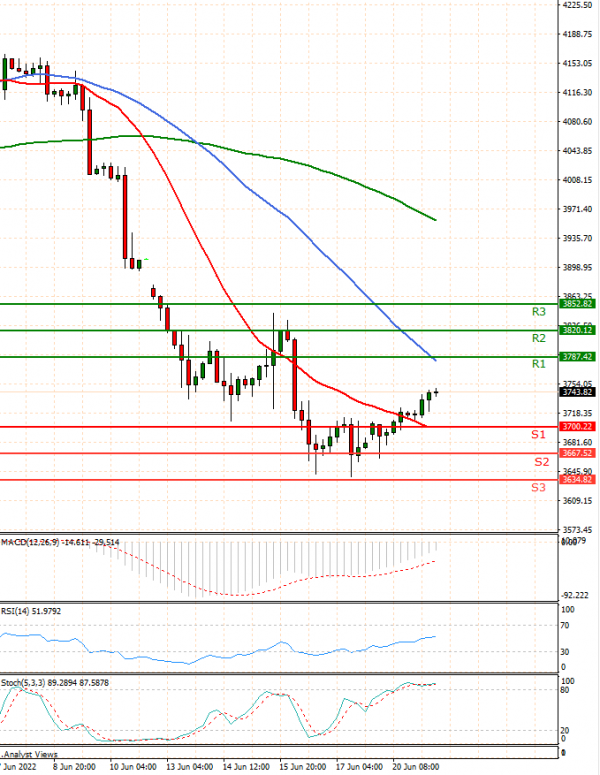
US Session Analysis for CFD Instruments 21/06/2022
Fundamental analysis
21 June, 2022
U.S. stock futures climbed, offering investors a reprieve from a recent stretch of whipsaw trading that had sent stocks and cryptocurrencies falling. Futures for the S&P 500 gained 1.8% Tuesday, while those for the Dow Jones Industrial Average added 1.6%. Investors’ appetite for riskier assets on Tuesday follows a tumultuous week in the markets, sparked by the Federal Reserve’s approval of a 0.75-percentage-point interest-rate increase, the largest since 1994. That sent investors scrambling to unload riskier assets amid growing fears that central bankers will plunge the U.S. economy into a recession. The benchmark S&P 500 finished the week 5.8% lower, its largest one-week decline in more than two years.