Fortrade Canada Ltd. as an order-execution only dealer is not permitted to provide you with any advice or recommendations. These Market Commentaries should not be construed as a recommendation, advice or any attempt by Fortrade Canada Ltd. to prompt or influence you in making an investment decision to purchase, sell, hold or exchange any security or to influence the timing of such activity. This content is produced by Fortrade Limited which is not registered in any capacity with any securities regulatory authority in Canada.
71% of retail investor accounts lose money when trading CFDs with this provider.
CFDs are complex instruments and come with a high risk of losing money rapidly due to leverage. 71% of retail investor accounts lose money when trading CFDs with this provider. You should consider whether you understand how CFDs work and whether you can afford to take the high risk of losing your money.
70.41% of retail investor accounts lose money when trading CFDs with this provider.
CFDs are complex instruments and come with a high risk of losing money rapidly due to leverage. 70.41% of retail investor accounts lose money when trading CFDs with this provider. You should consider whether you understand how CFDs work and whether you can afford to take the high risk of losing all your money. Read full risk warning.
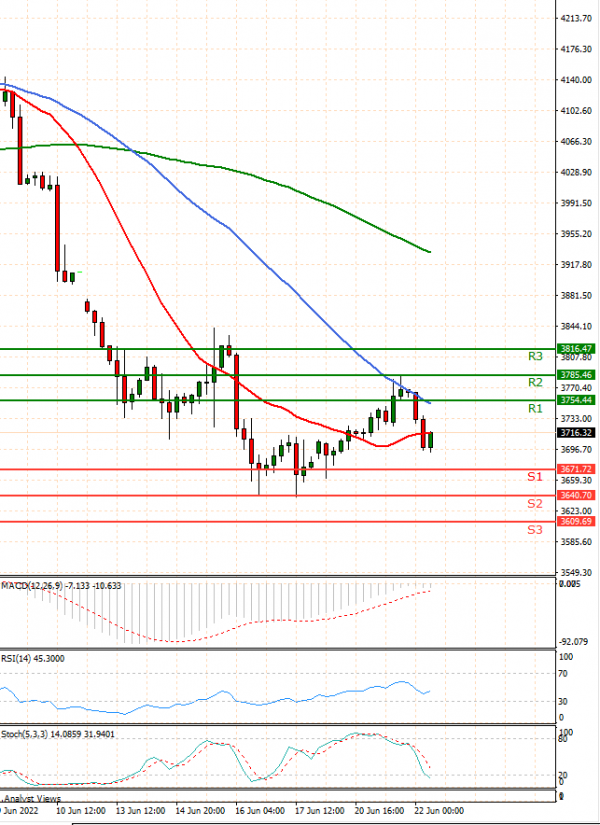
US Session Analysis for CFD Instruments 22/06/2022
Fundamental analysis
22 June, 2022
U.S. stock futures fell, oil prices dropped and bond yields ticked lower after major indexes rallied to start the trading week, with recent volatility in markets showing few signs of abating. Futures for the S&P 500 declined 1.7% Wednesday. Contracts for the tech-focused Nasdaq-100 contracted 2% and futures for the Dow Jones Industrial Average receded 1.5%. U.S. stocks rallied Tuesday off their worst week since March 2020, offering investors a reprieve from a recent stretch of whipsaw trading that had sent stocks and cryptocurrencies falling. Stocks have seen sharp moves in recent weeks following aggressive interest-rate increases from the Federal Reserve, with more expected, as central banking officials seek to put a cap on inflation. Investors have scrambled to unload riskier assets amid growing fears that quick tightening of financial conditions will plunge the U.S. economy into a recession. The S&P 500 is on track for its worst first half of the year in decades, according to Deutsche Bank research analysts.