Fortrade Canada Ltd. as an order-execution only dealer is not permitted to provide you with any advice or recommendations. These Market Commentaries should not be construed as a recommendation, advice or any attempt by Fortrade Canada Ltd. to prompt or influence you in making an investment decision to purchase, sell, hold or exchange any security or to influence the timing of such activity. This content is produced by Fortrade Limited which is not registered in any capacity with any securities regulatory authority in Canada.
69% of retail investor accounts lose money when trading CFDs with this provider.
CFDs are complex instruments and come with a high risk of losing money rapidly due to leverage. 69% of retail investor accounts lose money when trading CFDs with this provider. You should consider whether you understand how CFDs work and whether you can afford to take the high risk of losing your money.
67.52% of retail investor accounts lose money when trading CFDs with this provider.
CFDs are complex instruments and come with a high risk of losing money rapidly due to leverage. 67.52% of retail investor accounts lose money when trading CFDs with this provider. You should consider whether you understand how CFDs work and whether you can afford to take the high risk of losing all your money. Read full risk warning.
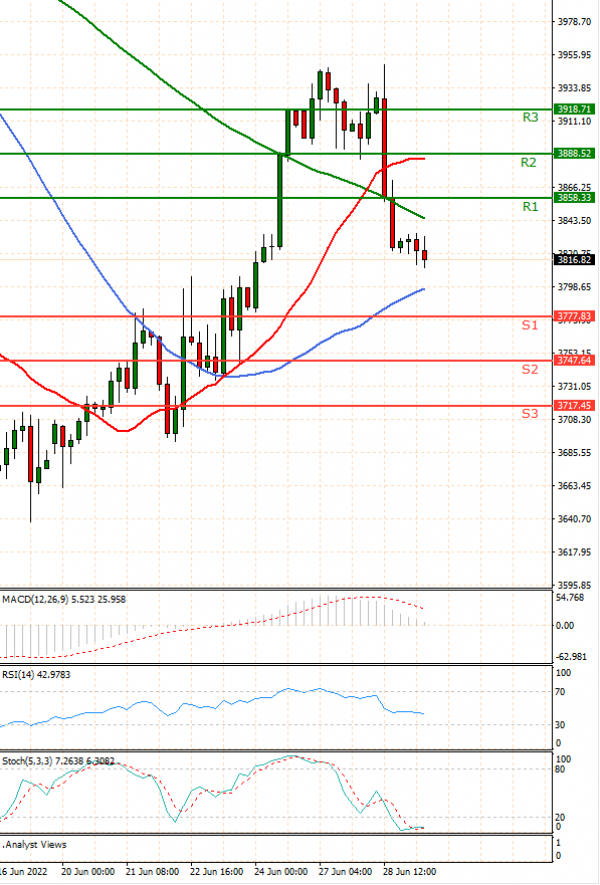
US Session Analysis for CFD Instruments 29/06/2022
Fundamental analysis
29 June, 2022
U.S. stock futures hovered ahead of a panel of major central bank officials that is expected to provide insight into their views on the economy, inflation and the path of monetary policy. Futures tied to the S&P 500 were little changed, oscillating between small gains and losses after the broad-market index closed down 2% on Tuesday. Nasdaq-100 futures ticked up 0.1%, pointing to muted moves for technology stocks after the opening bell. Stocks have started the week on a shaky note as a series of data releases showed that higher prices are weighing on consumer sentiment. Investors remained concerned about central banks tightening policy too aggressively while fighting inflation and causing a recession. The S&P 500 is down more than 2% so far this week and remains in a bear market, closing down just over 20% from its latest peak on Tuesday.