77% of retail investor accounts lose money when trading CFDs with this provider.
CFDs are complex instruments and come with a high risk of losing money rapidly due to leverage. 77% of retail investor accounts lose money when trading CFDs with this provider. You should consider whether you understand how CFDs work and whether you can afford to take the high risk of losing your money.
76% of retail investor accounts lose money when trading CFDs with this provider.
CFDs are complex instruments and come with a high risk of losing money rapidly due to leverage. 76% of retail investor accounts lose money when trading CFDs with this provider. You should consider whether you can afford to take the high risk of losing your money.
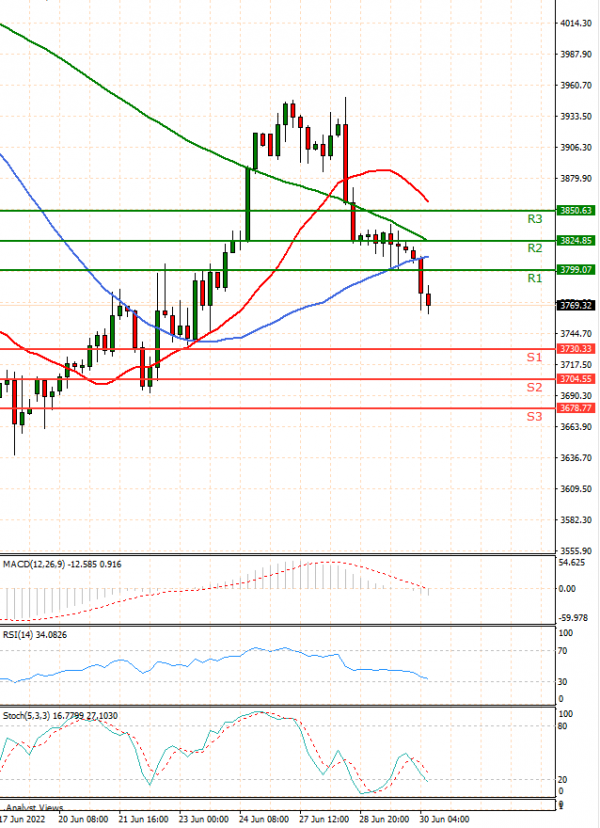
US Session Analysis for CFD Instruments 30/06/2022
Fundamental analysis
30 June, 2022
U.S. stock futures fell as investors rebalanced portfolios ahead of the end of a grueling first half and awaited a gauge of inflation that Federal Reserve officials consider their preferred measure of rising prices. Futures tied to the S&P 500 dropped 1.4%, a day after indexes finished little changed. The S&P 500 is on course to close out its worst first half of the year since the 1970s, as soaring inflation and rapidly rising interest rates raised the specter of recession. After initially discounting post pandemic inflation as transitory, the Federal Reserve and other global central banks have pivoted to making fighting it with interest-rate increases their most important priority, even if it means halting economic growth.