Fortrade Canada Ltd. as an order-execution only dealer is not permitted to provide you with any advice or recommendations. These Market Commentaries should not be construed as a recommendation, advice or any attempt by Fortrade Canada Ltd. to prompt or influence you in making an investment decision to purchase, sell, hold or exchange any security or to influence the timing of such activity. This content is produced by Fortrade Limited which is not registered in any capacity with any securities regulatory authority in Canada.
69% of retail investor accounts lose money when trading CFDs with this provider.
CFDs are complex instruments and come with a high risk of losing money rapidly due to leverage. 69% of retail investor accounts lose money when trading CFDs with this provider. You should consider whether you understand how CFDs work and whether you can afford to take the high risk of losing your money.
70.88% of retail investor accounts lose money when trading CFDs with this provider.
CFDs are complex instruments and come with a high risk of losing money rapidly due to leverage. 70.88% of retail investor accounts lose money when trading CFDs with this provider. You should consider whether you understand how CFDs work and whether you can afford to take the high risk of losing all your money. Read full risk warning.
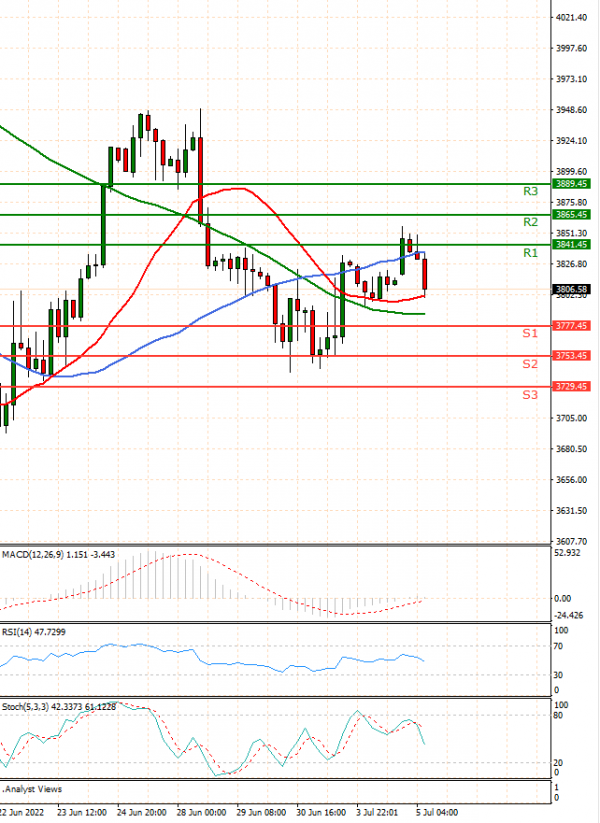
US Session Analysis for CFD Instruments 05/07/2022
Fundamental analysis
05 July, 2022
U.S. stock futures fell in choppy trading, as investors assessed the possibility of U.S. officials easing tariffs on Chinese imports. Futures for the S&P 500 fell 0.6% Tuesday to start the trading week after the U.S. stock and bond markets were closed for the Independence Day holiday. Contracts for the Dow Jones Industrial Average lost 0.5% and futures for the tech-focused Nasdaq-100 declined 0.7%. The U.S. stock market kicked off July trading on a positive note Friday, but investors say they are bracing for more pain ahead this year. Traders continue to remain focused on stubborn inflation that has forced central banks around the world to aggressively tighten monetary policy. Economic data showing sharp declines in metrics ranging from factory output to retail spending have exacerbated concerns that the U.S. economy could tumble into a recession.