Fortrade Canada Ltd. as an order-execution only dealer is not permitted to provide you with any advice or recommendations. These Market Commentaries should not be construed as a recommendation, advice or any attempt by Fortrade Canada Ltd. to prompt or influence you in making an investment decision to purchase, sell, hold or exchange any security or to influence the timing of such activity. This content is produced by Fortrade Limited which is not registered in any capacity with any securities regulatory authority in Canada.
71% of retail investor accounts lose money when trading CFDs with this provider.
CFDs are complex instruments and come with a high risk of losing money rapidly due to leverage. 71% of retail investor accounts lose money when trading CFDs with this provider. You should consider whether you understand how CFDs work and whether you can afford to take the high risk of losing your money.
70.41% of retail investor accounts lose money when trading CFDs with this provider.
CFDs are complex instruments and come with a high risk of losing money rapidly due to leverage. 70.41% of retail investor accounts lose money when trading CFDs with this provider. You should consider whether you understand how CFDs work and whether you can afford to take the high risk of losing all your money. Read full risk warning.
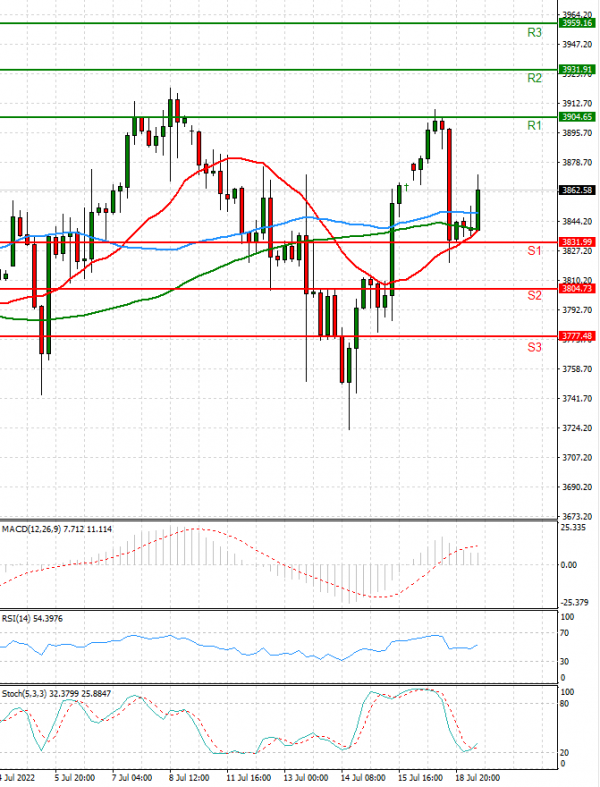
US Session Analysis for CFD Instruments 19/07/2022
Fundamental analysis
19 July, 2022
U.S. stock futures rose as investors awaited a fresh batch of earnings reports from major companies and looked ahead to a week of key central-bank meetings. Futures tied to the S&P 500 rose 0.7% Monday after the broad index on Friday ended higher, snapping a five-day losing streak. Blue-chip Dow Jones Industrial Average futures edged up 0.6% while technology-heavy Nasdaq-100 futures gained 1.1%. Major financial firms are set to kick off a bumper week of earnings reports Monday. Bank of America and Goldman Sachs are set to give updates ahead of the opening bell. Companies due to provide updates later this week include Johnson & Johnson on Tuesday, Tesla on Wednesday and Twitter on Friday.