Fortrade Canada Ltd. as an order-execution only dealer is not permitted to provide you with any advice or recommendations. These Market Commentaries should not be construed as a recommendation, advice or any attempt by Fortrade Canada Ltd. to prompt or influence you in making an investment decision to purchase, sell, hold or exchange any security or to influence the timing of such activity. This content is produced by Fortrade Limited which is not registered in any capacity with any securities regulatory authority in Canada.
70% of retail investor accounts lose money when trading CFDs with this provider.
CFDs are complex instruments and come with a high risk of losing money rapidly due to leverage. 70% of retail investor accounts lose money when trading CFDs with this provider. You should consider whether you understand how CFDs work and whether you can afford to take the high risk of losing your money.
70.41% of retail investor accounts lose money when trading CFDs with this provider.
CFDs are complex instruments and come with a high risk of losing money rapidly due to leverage. 70.41% of retail investor accounts lose money when trading CFDs with this provider. You should consider whether you understand how CFDs work and whether you can afford to take the high risk of losing all your money. Read full risk warning.
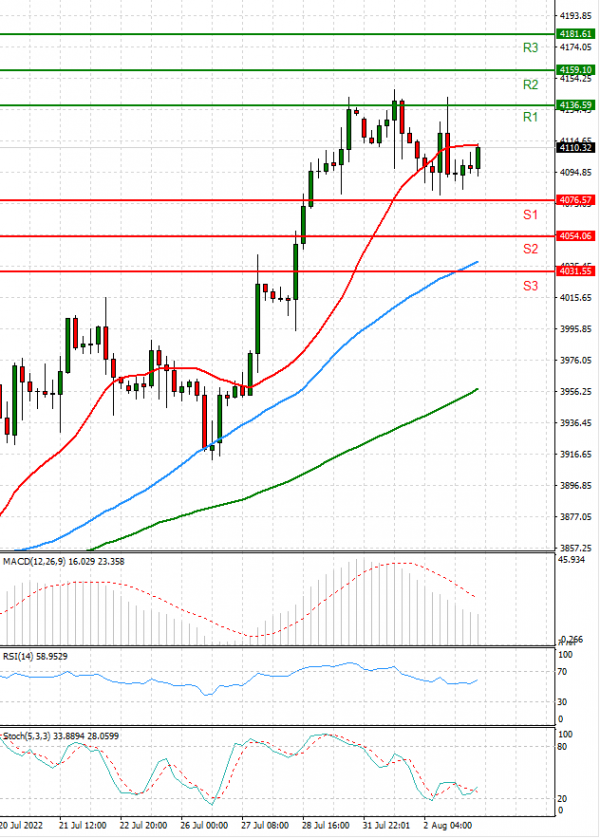
US Session Analysis for CFD Instruments 03/08/2022
Fundamental analysis
03 August, 2022
U.S. stock futures wobbled as investors digested comments from central bankers and ahead of fresh economic data on the services sector. Futures tied to the S&P 500 added 0.1%, pointing to the broad-market index hovering after it closed down 0.7% on Tuesday. Technology-heavy Nasdaq-100 futures were flat. Federal Reserve officials said the central bank was likely to continue raising interest rates at coming meetings, dampening hopes in markets that slowing economic growth could mean a change in policy. Stocks have also come under renewed pressure from geopolitical tensions, as U.S. House Speaker Nancy Pelosi met with Taiwan’s president despite warnings from China. The S&P 500 has lost nearly 1% this week so far.