Fortrade Canada Ltd. as an order-execution only dealer is not permitted to provide you with any advice or recommendations. These Market Commentaries should not be construed as a recommendation, advice or any attempt by Fortrade Canada Ltd. to prompt or influence you in making an investment decision to purchase, sell, hold or exchange any security or to influence the timing of such activity. This content is produced by Fortrade Limited which is not registered in any capacity with any securities regulatory authority in Canada.
70% of retail investor accounts lose money when trading CFDs with this provider.
CFDs are complex instruments and come with a high risk of losing money rapidly due to leverage. 70% of retail investor accounts lose money when trading CFDs with this provider. You should consider whether you understand how CFDs work and whether you can afford to take the high risk of losing your money.
70.41% of retail investor accounts lose money when trading CFDs with this provider.
CFDs are complex instruments and come with a high risk of losing money rapidly due to leverage. 70.41% of retail investor accounts lose money when trading CFDs with this provider. You should consider whether you understand how CFDs work and whether you can afford to take the high risk of losing all your money. Read full risk warning.
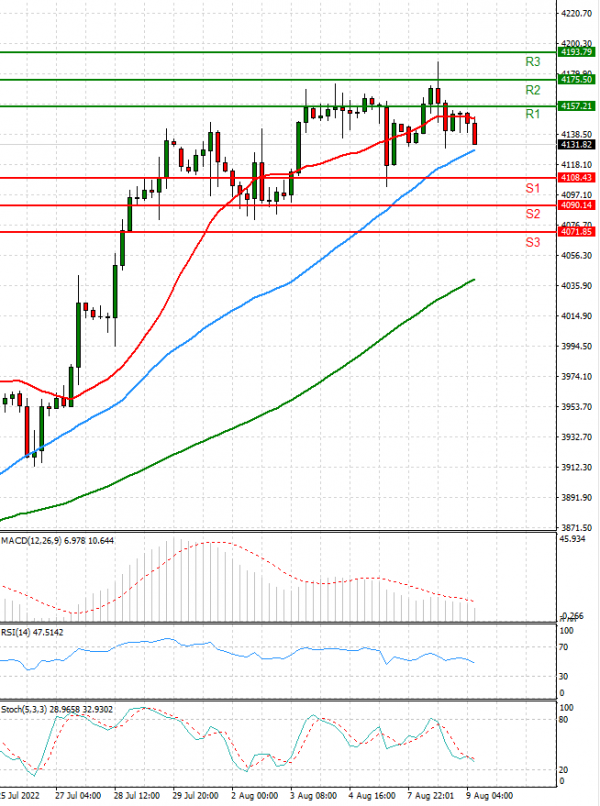
US Session Analysis for CFD Instruments 09/08/2022
Fundamental analysis
09 August, 2022
U.S. stock futures inched higher as investors monitored earnings reports and economic data ahead of key inflation figures due later in the week. Futures tied to the S&P 500 added 0.2%, a day after the broad index finished with modest losses. Indexes have settled into an August lull as investors await consumer-price data on Wednesday which could set expectations for how the Federal Reserve will approach monetary policy at its coming meetings. In recent weeks, better-than-expected corporate earnings and strong labor market data have dispelled concerns about an imminent U.S. recession, helping stock markets rebound from their lows.