77% of retail investor accounts lose money when trading CFDs with this provider.
CFDs are complex instruments and come with a high risk of losing money rapidly due to leverage. 77% of retail investor accounts lose money when trading CFDs with this provider. You should consider whether you understand how CFDs work and whether you can afford to take the high risk of losing your money.
76% of retail investor accounts lose money when trading CFDs with this provider.
CFDs are complex instruments and come with a high risk of losing money rapidly due to leverage. 76% of retail investor accounts lose money when trading CFDs with this provider. You should consider whether you can afford to take the high risk of losing your money.
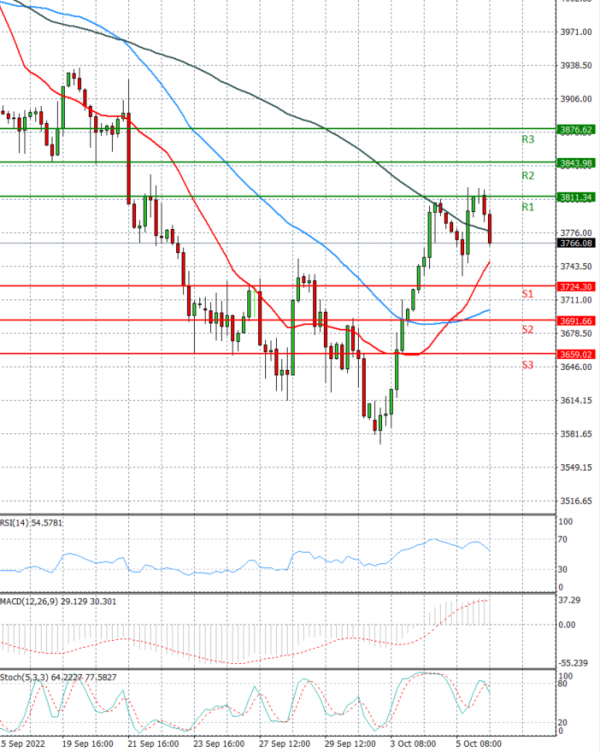
US Session Analysis for CFD Instruments 06/10/2022
Fundamental analysis
06 October, 2022
U.S. stock futures wobbled Thursday, suggesting major indexes could stumble for a second day in a row following their strong start to October. Stocks closed lower yesterday as investors continued to worry about the potential length and depth of the recession and the prospect of future interest rate hikes.