77% of retail investor accounts lose money when trading CFDs with this provider.
CFDs are complex instruments and come with a high risk of losing money rapidly due to leverage. 77% of retail investor accounts lose money when trading CFDs with this provider. You should consider whether you understand how CFDs work and whether you can afford to take the high risk of losing your money.
76% of retail investor accounts lose money when trading CFDs with this provider.
CFDs are complex instruments and come with a high risk of losing money rapidly due to leverage. 76% of retail investor accounts lose money when trading CFDs with this provider. You should consider whether you can afford to take the high risk of losing your money.
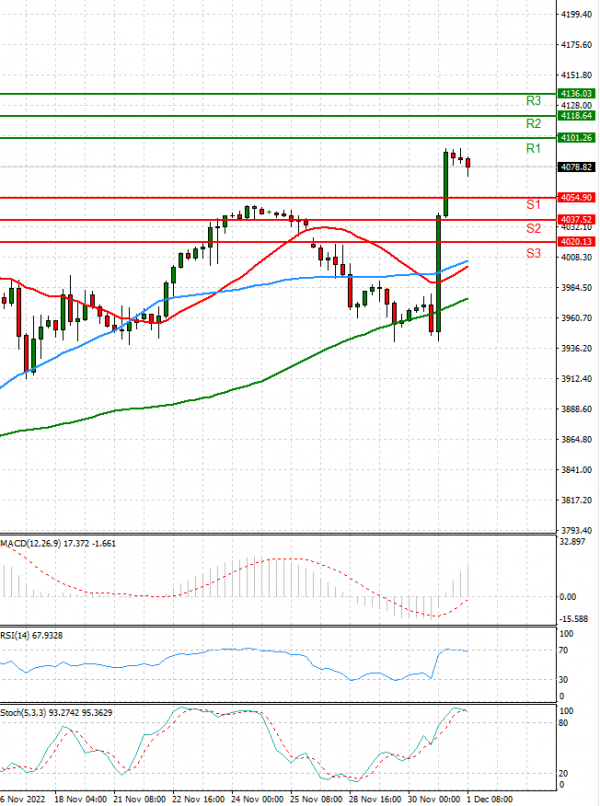
US Session Analysis for CFD Instruments 01/12/2022
Fundamental analysis
01 December, 2022
Stock futures wobbled, pointing to a pause in the rally that propelled the Dow Jones Industrial Average into a new bull market Wednesday after Federal Reserve Chair Jerome Powell signalled a potential slowdown in interest-rate increases.