CFDs are complex instruments and come with a high risk of losing money rapidly due to leverage. 71% of retail investor accounts lose money when trading CFDs with this provider. You should consider whether you understand how CFDs work and whether you can afford to take the high risk of losing your money.
CFDs are complex instruments and come with a high risk of losing money rapidly due to leverage. 70.91% of retail investor accounts lose money when trading CFDs with this provider. You should consider whether you understand how CFDs work and whether you can afford to take the high risk of losing all your money. Read full risk warning.

USA500 Analysis

US Session Analysis for CFD Instruments 25/10/2023

Fundamental analysis

25 October, 2023

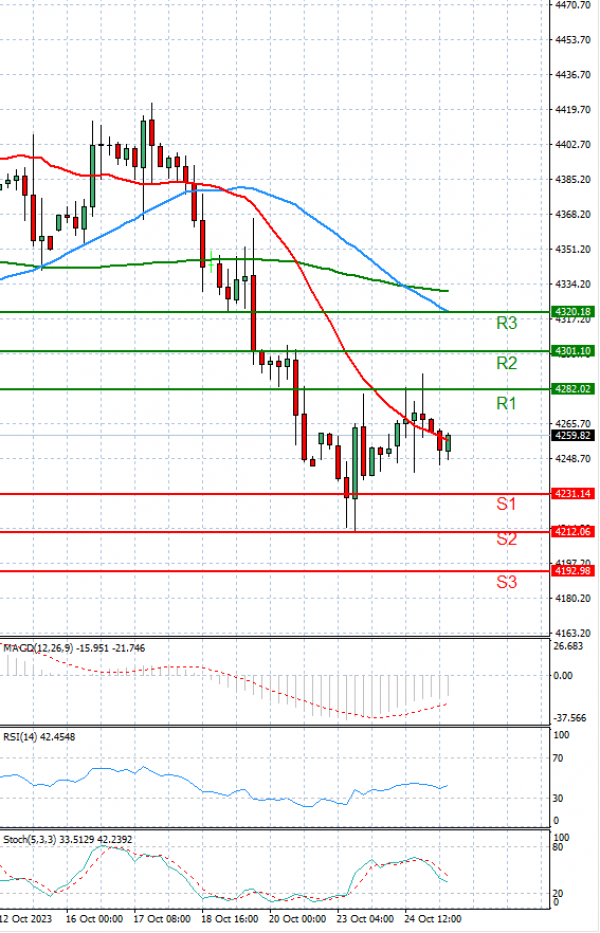
The USA 500 is trading steady today at 4,227.

S&P 500 futures were slightly lower Wednesday morning as investors digested quarterly results from tech giants Microsoft and Alphabet.

Futures tied to the S&P 500 lost 0.4%. Nasdaq 100 futures fell 0.6%. Meanwhile, Dow Jones Industrial Average futures were flat.

Shares of Microsoft jumped 3.5% following stronger-than-expected results in the fiscal first quarter. Investors were particularly optimistic on the company’s revenue growth, particularly from its Azure cloud segment. Meanwhile, Alphabet shares tumbled more than 6% as its cloud business missed analysts’ estimates, overshadowing its revenue growth and earnings beat.

Technical analysis

USA500 Analysis Technical analysis 25/10/2023
Time Frame: 1 hour

USA500 Support & Resistance Table - 25/10/2023

Support & Resistance Level Explanation
Resistance 2 4301.10 Daily R2
Resistance 1 4282.02 Daily R1
Support 1 4231.14 Daily S1
Support 2 4212.06 Daily S2

USA500 Indicator Table - 25/10/2023

Indicator Signal
SMA 20 Sell
SMA 50 Sell
SMA 100 Sell
MACD( 12;26;9) Sell
RSI (14) Sell
Stochastic ( 9;6;3) Sell

USA500 Indicator / Period Table - 25/10/2023

Indicator / Period Day - SellWeek - SellMonth - Sell
MACD( 12;26;9) Sell SellBuy
RSI (14) Sell SellSell
SMA 20 Sell SellSell

USA500 25/10/2023 - Reference Price : 4256.58

Sell
Simple Moving AverageBuy (0)Sell (3)
Technical Indicators - OscillatorsBuy (0)Sell (3)
Share It With Your Network
USA500 Chart
Update Time: -
Highest
Lowest
1M 5M H D W
Prices are loading..
Ready for trading?Start Now