Fortrade Canada Ltd. as an order-execution only dealer is not permitted to provide you with any advice or recommendations. These Market Commentaries should not be construed as a recommendation, advice or any attempt by Fortrade Canada Ltd. to prompt or influence you in making an investment decision to purchase, sell, hold or exchange any security or to influence the timing of such activity. This content is produced by Fortrade Limited which is not registered in any capacity with any securities regulatory authority in Canada.
69% of retail investor accounts lose money when trading CFDs with this provider.
CFDs are complex instruments and come with a high risk of losing money rapidly due to leverage. 69% of retail investor accounts lose money when trading CFDs with this provider. You should consider whether you understand how CFDs work and whether you can afford to take the high risk of losing your money.
67.52% of retail investor accounts lose money when trading CFDs with this provider.
CFDs are complex instruments and come with a high risk of losing money rapidly due to leverage. 67.52% of retail investor accounts lose money when trading CFDs with this provider. You should consider whether you understand how CFDs work and whether you can afford to take the high risk of losing all your money. Read full risk warning.
US Session Analysis for CFD Instruments 22/11/2023
Fundamental analysis
22 November, 2023
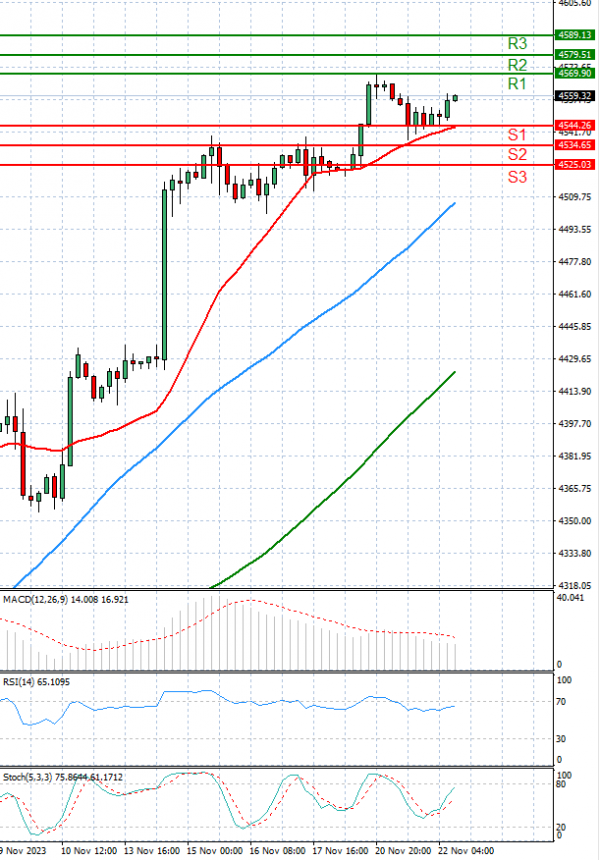
The USA500 is trading at 4,544. U.S. stocks retreated on Tuesday, with the S&P 500 and Nasdaq snapping five-session winning streaks as retailers declined after some disappointing outlooks and as technology shares fell. Indexes stayed lower after minutes from the latest Federal Reserve meeting showed officials agreed to take a cautious approach to raising U.S. interest rates going forward. U.S. central bank officials also said they would only raise interest rates if progress in controlling inflation faltered, according to minutes from the Oct. 31-Nov. 1 meeting.