CFDs are complex instruments and come with a high risk of losing money rapidly due to leverage. 71% of retail investor accounts lose money when trading CFDs with this provider. You should consider whether you understand how CFDs work and whether you can afford to take the high risk of losing your money.
CFDs are complex instruments and come with a high risk of losing money rapidly due to leverage. 70.41% of retail investor accounts lose money when trading CFDs with this provider. You should consider whether you understand how CFDs work and whether you can afford to take the high risk of losing all your money. Read full risk warning.

USA500 Analysis

US Session Analysis for CFD Instruments 13/12/2023

Fundamental analysis

13 December, 2023

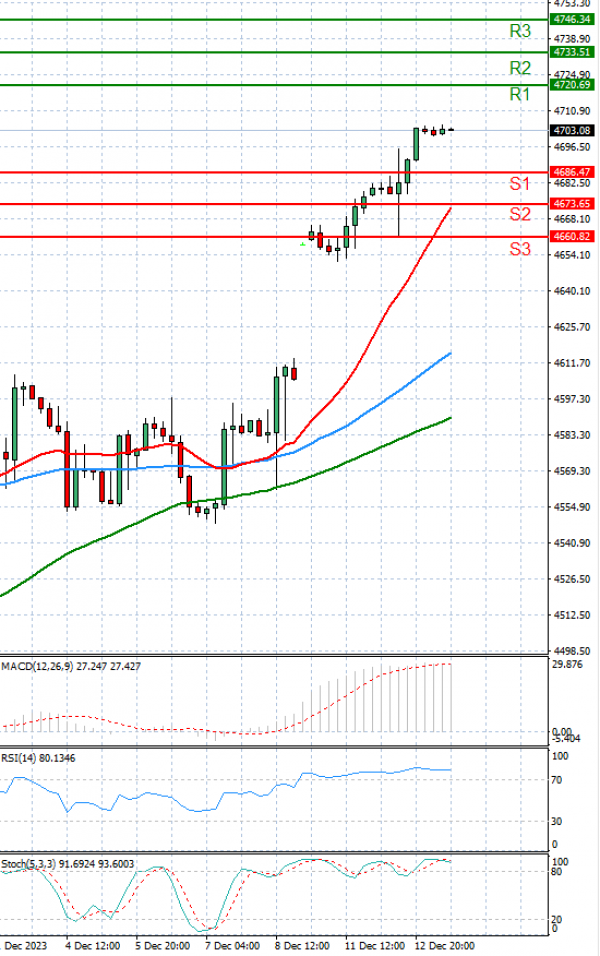
The USA500 is trading at 4,648.

Fresh inflation data released Tuesday kept investors’ soft-landing hopes alive, propelling U.S. stocks upward.

The S&P 500 rose 0.5%. The Dow Jones Industrial Average gained 173 points, or 0.5%. The Nasdaq Composite added 0.7%.

All three indexes closed at fresh 52-week highs for a third session in a row. The S&P 500 and Dow rose to their highest closing levels since January 2022, while the Nasdaq reached its highest close since March 2022. The major indexes are going on their seventh consecutive week of gains.

Technical analysis

USA500 Analysis Technical analysis 13/12/2023
Time Frame: 1 hour

USA500 Support & Resistance Table - 13/12/2023

Support & Resistance Level Explanation
Resistance 2 4733.51 Daily R2
Resistance 1 4720.69 Daily R1
Support 1 4686.47 Daily S1
Support 2 4673.65 Daily S2

USA500 Indicator Table - 13/12/2023

Indicator Signal
SMA 20 Buy
SMA 50 Buy
SMA 100 Buy
MACD( 12;26;9) Buy
RSI (14) Buy
Stochastic ( 9;6;3) Buy

USA500 Indicator / Period Table - 13/12/2023

Indicator / Period Day - BuyWeek - BuyMonth - Buy
MACD( 12;26;9) Buy BuyBuy
RSI (14) Buy BuyBuy
SMA 20 Buy BuyBuy

USA500 13/12/2023 - Reference Price : 4703.58

Buy
Simple Moving AverageBuy (3)Sell (0)
Technical Indicators - OscillatorsBuy (3)Sell (0)
Share It With Your Network
USA500 Chart
Update Time: -
Highest
Lowest
1M 5M H D W
Prices are loading..
Ready for trading?Start Now