Fortrade Canada Ltd. as an order-execution only dealer is not permitted to provide you with any advice or recommendations. These Market Commentaries should not be construed as a recommendation, advice or any attempt by Fortrade Canada Ltd. to prompt or influence you in making an investment decision to purchase, sell, hold or exchange any security or to influence the timing of such activity. This content is produced by Fortrade Limited which is not registered in any capacity with any securities regulatory authority in Canada.
69% of retail investor accounts lose money when trading CFDs with this provider.
CFDs are complex instruments and come with a high risk of losing money rapidly due to leverage. 69% of retail investor accounts lose money when trading CFDs with this provider. You should consider whether you understand how CFDs work and whether you can afford to take the high risk of losing your money.
67.52% of retail investor accounts lose money when trading CFDs with this provider.
CFDs are complex instruments and come with a high risk of losing money rapidly due to leverage. 67.52% of retail investor accounts lose money when trading CFDs with this provider. You should consider whether you understand how CFDs work and whether you can afford to take the high risk of losing all your money. Read full risk warning.
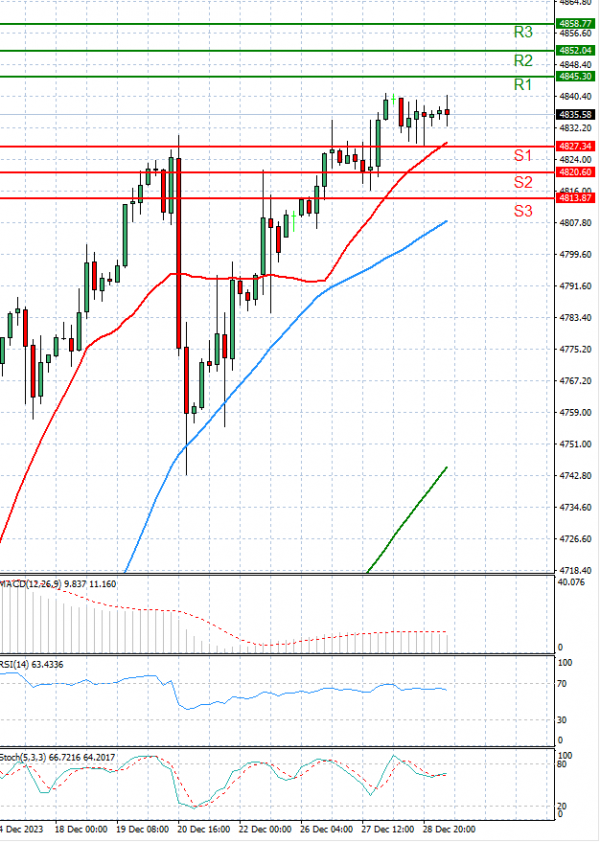
US Session Analysis for CFD Instruments 29/12/2023
Fundamental analysis
29 December, 2023
The USA500 is trading at 4,789.
US stocks closed mixed on Thursday, and the S&P 500 stopped just shy of a new all-time high as the Santa Claus rally has yet to push the benchmark index past the milestone.
The S&P 500 remains within a whisker of its January 3, 2022 closing high of 7,796.56, but is closing out a banner year. It's up nearly 25% as investors spent much of 2023 cheering the strength of America's economy and laying bets in the latter part of the year that the Federal Reserve is poised to cut interest rates in early 2024.