The USA500 is trading currently at 4,760.
Global stock indexes mostly dipped and Treasury yields edged higher on Tuesday, with investors bracing for key U.S. inflation data this week and the start of fourth-quarter company earnings.
All eyes will be on the U.S. consumer prices report for December, due on Thursday. It is expected to show headline inflation rose 0.2% in the month and by 3.2% on an annual basis.
The Dow Jones Industrial Average fell 157.85 points, or 0.42%, to 37,525.16, the S&P 500 lost 7.04 points, or 0.15%, to 4,756.50 and the NASDAQ gained 13.94 points, or 0.09%, to 14,857.71.
USA500 Analysis
US Session Analysis for CFD Instruments 10/01/2024
Technical analysis
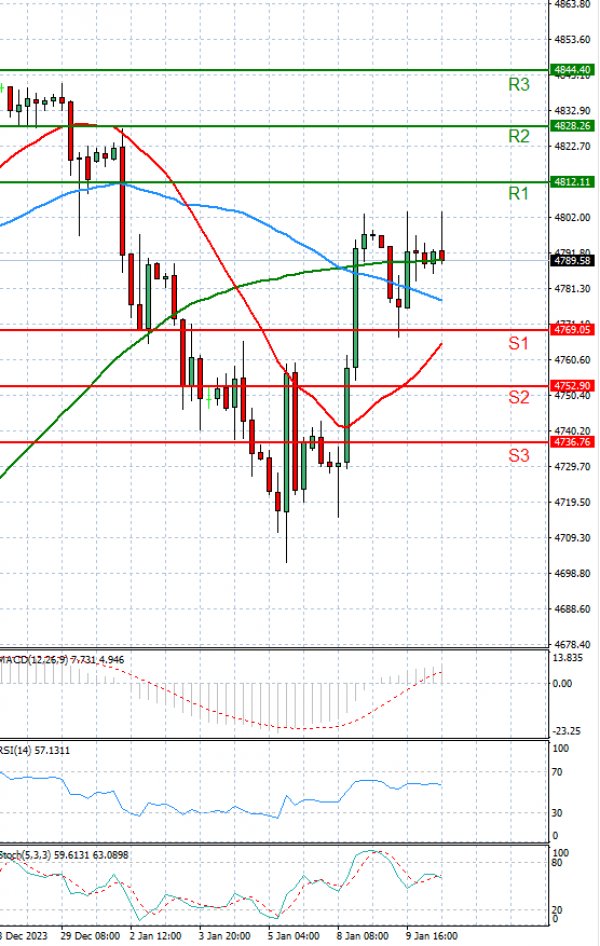
Time Frame: 1 hour
USA500 Support & Resistance Table - 10/01/2024
| Support & Resistance | Level | Explanation |
| Resistance 2 | 4828.26 | Daily R2 |
| Resistance 1 | 4812.11 | Daily R1 |
| Support 1 | 4769.05 | Daily S1 |
| Support 2 | 4752.90 | Daily S2 |
USA500 Indicator Table - 10/01/2024
| Indicator | Signal |
| SMA 20 | Buy |
| SMA 50 | Buy |
| SMA 100 | Buy |
| MACD( 12;26;9) | Buy |
| RSI (14) | Buy |
| Stochastic ( 9;6;3) | Buy |
USA500 Indicator / Period Table - 10/01/2024
| Indicator / Period | Day - Buy | Week - Buy | Month - Buy |
| MACD( 12;26;9) | Buy | Buy | Buy |
| RSI (14) | Buy | Buy | Buy |
| SMA 20 | Buy | Buy | Buy |
USA500 10/01/2024 - Reference Price : 4790.58
| Buy |
|
Ready for trading?Start Now