CFDs are complex instruments and come with a high risk of losing money rapidly due to leverage. 71% of retail investor accounts lose money when trading CFDs with this provider. You should consider whether you understand how CFDs work and whether you can afford to take the high risk of losing your money.
CFDs are complex instruments and come with a high risk of losing money rapidly due to leverage. 70.91% of retail investor accounts lose money when trading CFDs with this provider. You should consider whether you understand how CFDs work and whether you can afford to take the high risk of losing all your money. Read full risk warning.

USA500 Analysis

US Session Analysis for CFD Instruments 21/03/2024

Fundamental analysis

21 March, 2024

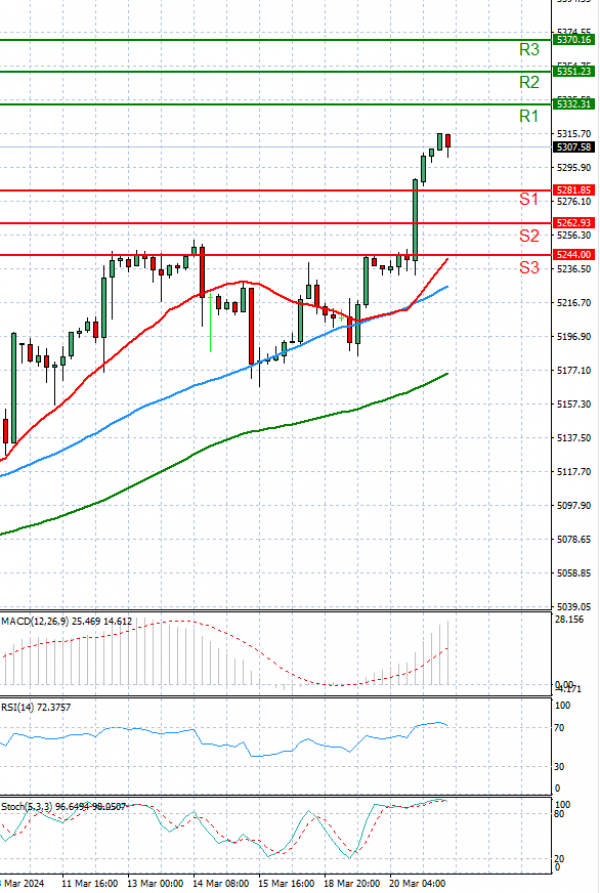
The USA500 is currently trading higher just above 5,200 levels.

On Thursday, U.S. stock futures exhibited an upward trend, indicating that the major indices are poised to extend their record closing levels. This surge follows the Federal Reserve's maintenance of the possibility of three interest rate cuts within the year.

The Dow futures contract showed a gain of 120 points, or 0.3%, while S&P 500 futures rose by 22 points, equivalent to 0.4%, and Nasdaq 100 futures climbed by 140 points, marking a rise of 0.8%.

Wednesday saw a victorious day for the main indices, with both the Dow Jones Industrial Average and the Nasdaq Composite surging over 1%, and the S&P 500 ascending by 0.9%, all achieving new record closing highs.

This optimistic sentiment, fueled by expectations that the U.S. central bank may commence interest rate cuts in June, is anticipated to persist in this session, as investors digest data concerning jobless claims and existing home sales.

Technical analysis

USA500 Analysis Technical analysis 21/03/2024
Time Frame: 1 hour

USA500 Support & Resistance Table - 21/03/2024

Support & Resistance Level Explanation
Resistance 2 5351.23 Daily R2
Resistance 1 5332.31 Daily R1
Support 1 5281.85 Daily S1
Support 2 5262.93 Daily S2

USA500 Indicator Table - 21/03/2024

Indicator Signal
SMA 20 Buy
SMA 50 Buy
SMA 100 Buy
MACD( 12;26;9) Buy
RSI (14) Buy
Stochastic ( 9;6;3) Buy

USA500 Indicator / Period Table - 21/03/2024

Indicator / Period Day - BuyWeek - BuyMonth - Buy
MACD( 12;26;9) Buy BuyBuy
RSI (14) Buy BuyBuy
SMA 20 Buy BuyBuy

USA500 21/03/2024 - Reference Price : 5307.08

Buy
Simple Moving AverageBuy (3)Sell (0)
Technical Indicators - OscillatorsBuy (3)Sell (0)
Share It With Your Network
USA500 Chart
Update Time: -
Highest
Lowest
1M 5M H D W
Prices are loading..
Ready for trading?Start Now