CFDs are complex instruments and come with a high risk of losing money rapidly due to leverage. 77% of retail investor accounts lose money when trading CFDs with this provider. You should consider whether you understand how CFDs work and whether you can afford to take the high risk of losing your money.
CFDs are complex instruments and come with a high risk of losing money rapidly due to leverage. 76% of retail investor accounts lose money when trading CFDs with this provider. You should consider whether you can afford to take the high risk of losing your money.

USA500 Analysis

US Session Analysis for CFD Instruments 27/03/2024

Fundamental analysis

27 March, 2024

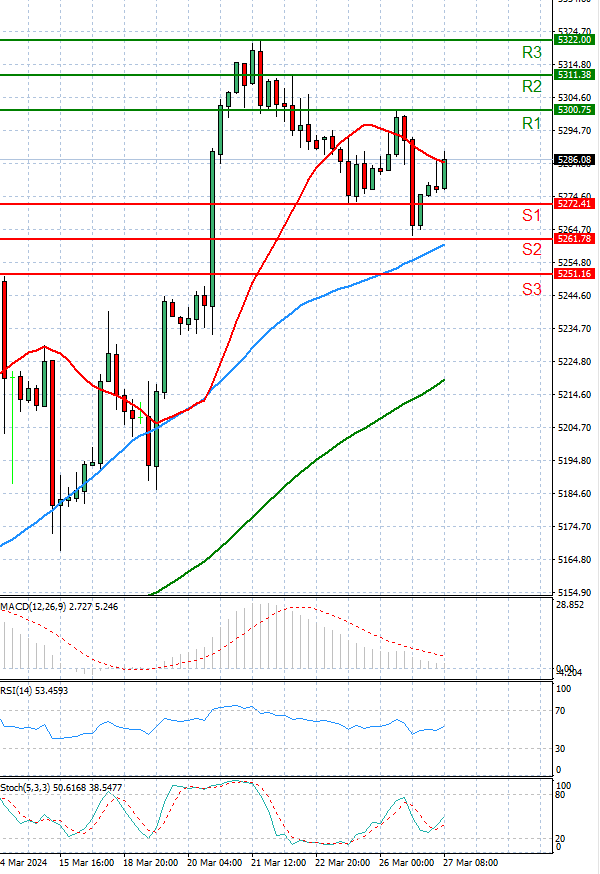
The USA500 is currently trading above 5,200 levels.

On Wednesday, US futures showed a slight uptick amidst a cautious week for investors leading up to Friday's PCE data release.

S&P 500 futures increased by 0.33%, while Dow Jones Industrial Average futures rose by 0.35% and Nasdaq 100 futures climbed by 0.36%.

Stocks closed lower on Tuesday as the market retreated further from last week's rally.

The S&P 500 experienced its third consecutive day of decline, finishing 0.28% lower. The Nasdaq Composite also saw a decrease of 0.42%, while the Dow slipped by 0.08%.

Despite these declines, equities have had a strong start to the year and are poised to end the month with gains.

Technical analysis

USA500 Analysis Technical analysis 27/03/2024
Time Frame: 1 hour

USA500 Support & Resistance Table - 27/03/2024

Support & Resistance Level Explanation
Resistance 2 5311.38 Daily R2
Resistance 1 5300.75 Daily R1
Support 1 5272.41 Daily S1
Support 2 5261.78 Daily S2

USA500 Indicator Table - 27/03/2024

Indicator Signal
SMA 20 Neutral
SMA 50 Buy
SMA 100 Buy
MACD( 12;26;9) Buy
RSI (14) Buy
Stochastic ( 9;6;3) Buy

USA500 Indicator / Period Table - 27/03/2024

Indicator / Period Day - BuyWeek - BuyMonth - Buy
MACD( 12;26;9) Buy BuyBuy
RSI (14) Buy BuyBuy
SMA 20 Buy BuyBuy

USA500 27/03/2024 - Reference Price : 5286.58

Buy
Simple Moving AverageBuy (2)Sell (0)
Technical Indicators - OscillatorsBuy (3)Sell (0)
Share It With Your Network
USA500 Chart
Update Time: -
Highest
Lowest
1M 5M H D W
Prices are loading..
Ready for trading?Start Now