CFDs are complex instruments and come with a high risk of losing money rapidly due to leverage. 71% of retail investor accounts lose money when trading CFDs with this provider. You should consider whether you understand how CFDs work and whether you can afford to take the high risk of losing your money.
CFDs are complex instruments and come with a high risk of losing money rapidly due to leverage. 70.41% of retail investor accounts lose money when trading CFDs with this provider. You should consider whether you understand how CFDs work and whether you can afford to take the high risk of losing all your money. Read full risk warning.

USA500 Analysis

US Session Analysis for CFD Instruments 12/04/2024

Fundamental analysis

12 April, 2024

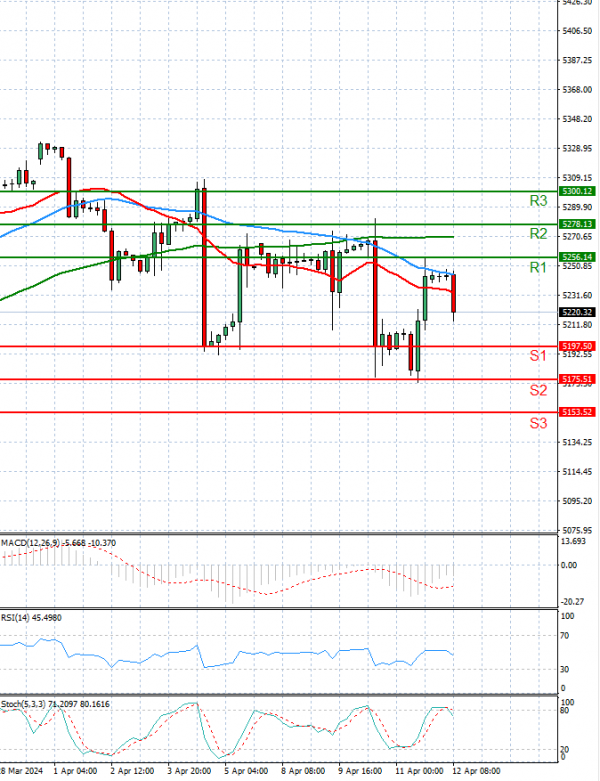
The USA500 is currently trading around 5,200 levels.

U.S. stock index futures traded narrowly on Friday as investors awaited earnings reports from major banks to assess corporate performance in the current high interest rate environment.

This marks the unofficial start of the quarterly earnings season, with reports expected from JPMorgan Chase & Co, Citigroup, and Wells Fargo & Co. Despite shaken sentiment due to higher-than-expected inflation data this week, the Nasdaq was set for its first weekly gain in three, while the Dow and the S&P 500 eyed weekly losses.

Dow futures rose 67 points, or 0.17%, S&P 500 futures gained 1.75 points, or 0.03%, and Nasdaq 100 futures fell 13.5 points, or 0.07%.

Technical analysis

USA500 Analysis Technical analysis 12/04/2024
Time Frame: 1 hour

USA500 Support & Resistance Table - 12/04/2024

Support & Resistance Level Explanation
Resistance 2 5278.13 Daily R2
Resistance 1 5256.14 Daily R1
Support 1 5197.50 Daily S1
Support 2 5175.51 Daily S2

USA500 Indicator Table - 12/04/2024

Indicator Signal
SMA 20 Sell
SMA 50 Sell
SMA 100 Buy
MACD( 12;26;9) Sell
RSI (14) Sell
Stochastic ( 9;6;3) Buy

USA500 Indicator / Period Table - 12/04/2024

Indicator / Period Day - SellWeek - SellMonth - Buy
MACD( 12;26;9) Sell BuyBuy
RSI (14) Sell SellBuy
SMA 20 Sell SellBuy

USA500 12/04/2024 - Reference Price : 5226.82

Sell
Simple Moving AverageBuy (0)Sell (3)
Technical Indicators - OscillatorsBuy (1)Sell (2)
Share It With Your Network
USA500 Chart
Update Time: -
Highest
Lowest
1M 5M H D W
Prices are loading..
Ready for trading?Start Now