CFDs are complex instruments and come with a high risk of losing money rapidly due to leverage. 77% of retail investor accounts lose money when trading CFDs with this provider. You should consider whether you understand how CFDs work and whether you can afford to take the high risk of losing your money.
CFDs are complex instruments and come with a high risk of losing money rapidly due to leverage. 76% of retail investor accounts lose money when trading CFDs with this provider. You should consider whether you can afford to take the high risk of losing your money.

USA500 Analysis

US Session Analysis for CFD Instruments 22/04/2024

Fundamental analysis

22 April, 2024

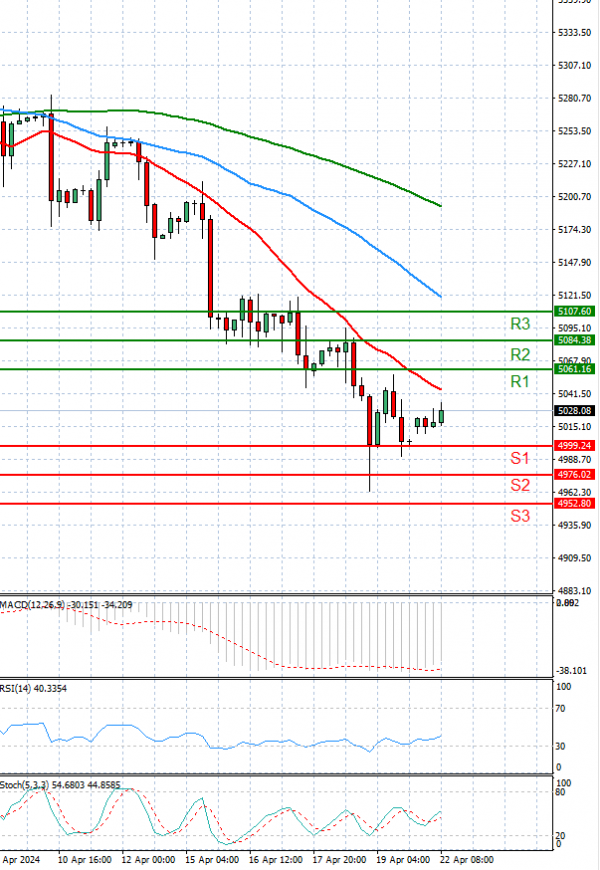
The USA500 is currently trading above 4,950 levels.

U.S. stock futures showed a modest uptick on Monday after last week's tech sector sell-off.

Dow futures rose 0.3%, S&P 500 futures climbed 0.4%, and Nasdaq 100 futures were up by 0.5%.

The S&P 500 and Nasdaq Composite indices dropped over 3% and 5.5% respectively last week due to inflation concerns, reducing expectations of multiple Fed rate cuts in 2024.

The Dow Jones Industrial Average fared better due to its lower tech exposure.

This week, focus will be on the release of the monthly personal consumption expenditures price index, a key inflation gauge, and quarterly earnings reports from the tech sector.

Technical analysis

USA500 Analysis Technical analysis 22/04/2024
Time Frame: 1 hour

USA500 Support & Resistance Table - 22/04/2024

Support & Resistance Level Explanation
Resistance 2 5084.38 Daily R2
Resistance 1 5061.16 Daily R1
Support 1 4999.24 Daily S1
Support 2 4976.02 Daily S2

USA500 Indicator Table - 22/04/2024

Indicator Signal
SMA 20 Sell
SMA 50 Sell
SMA 100 Sell
MACD( 12;26;9) Sell
RSI (14) Sell
Stochastic ( 9;6;3) Sell

USA500 Indicator / Period Table - 22/04/2024

Indicator / Period Day - SellWeek - SellMonth - Buy
MACD( 12;26;9) Sell SellBuy
RSI (14) Sell SellBuy
SMA 20 Sell SellSell

USA500 22/04/2024 - Reference Price : 5030.20

Sell
Simple Moving AverageBuy (0)Sell (3)
Technical Indicators - OscillatorsBuy (0)Sell (3)
Share It With Your Network
USA500 Chart
Update Time: -
Highest
Lowest
1M 5M H D W
Prices are loading..
Ready for trading?Start Now