Fortrade Canada Ltd. as an order-execution only dealer is not permitted to provide you with any advice or recommendations. These Market Commentaries should not be construed as a recommendation, advice or any attempt by Fortrade Canada Ltd. to prompt or influence you in making an investment decision to purchase, sell, hold or exchange any security or to influence the timing of such activity. This content is produced by Fortrade Limited which is not registered in any capacity with any securities regulatory authority in Canada.
71% of retail investor accounts lose money when trading CFDs with this provider.
CFDs are complex instruments and come with a high risk of losing money rapidly due to leverage. 71% of retail investor accounts lose money when trading CFDs with this provider. You should consider whether you understand how CFDs work and whether you can afford to take the high risk of losing your money.
70.91% of retail investor accounts lose money when trading CFDs with this provider.
CFDs are complex instruments and come with a high risk of losing money rapidly due to leverage. 70.91% of retail investor accounts lose money when trading CFDs with this provider. You should consider whether you understand how CFDs work and whether you can afford to take the high risk of losing all your money. Read full risk warning.
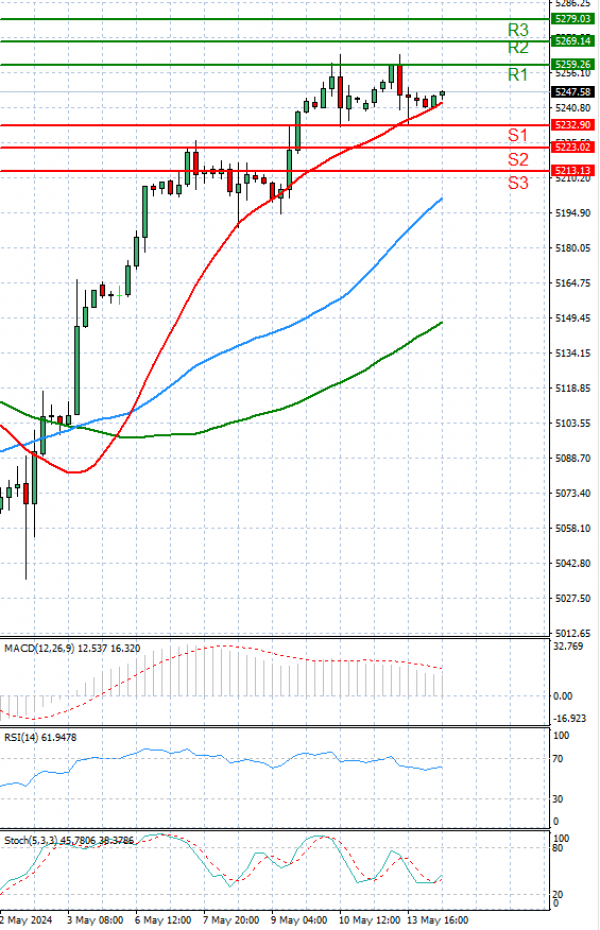
US Session Analysis for CFD Instruments 14/05/2024
Fundamental analysis
14 May, 2024
The USA500 is currently trading above 5,200 levels.
U.S. stock futures remained steady near the flatline on Tuesday as investors anticipated the release of crucial inflation data later in the week, which could influence the Federal Reserve's approach to future interest rate decisions.
In the previous session, the main averages on Wall Street exhibited mixed performance, with the benchmark S&P 500 registering a slight decline of 0.02%. This cautious sentiment indicated that traders were exercising prudence ahead of Wednesday's release of April's consumer price index figures.