CFDs are complex instruments and come with a high risk of losing money rapidly due to leverage. 71% of retail investor accounts lose money when trading CFDs with this provider. You should consider whether you understand how CFDs work and whether you can afford to take the high risk of losing your money.
CFDs are complex instruments and come with a high risk of losing money rapidly due to leverage. 70.91% of retail investor accounts lose money when trading CFDs with this provider. You should consider whether you understand how CFDs work and whether you can afford to take the high risk of losing all your money. Read full risk warning.

USA500 Analysis

US Session Analysis for CFD Instruments 17/05/2024

Fundamental analysis

17 May, 2024

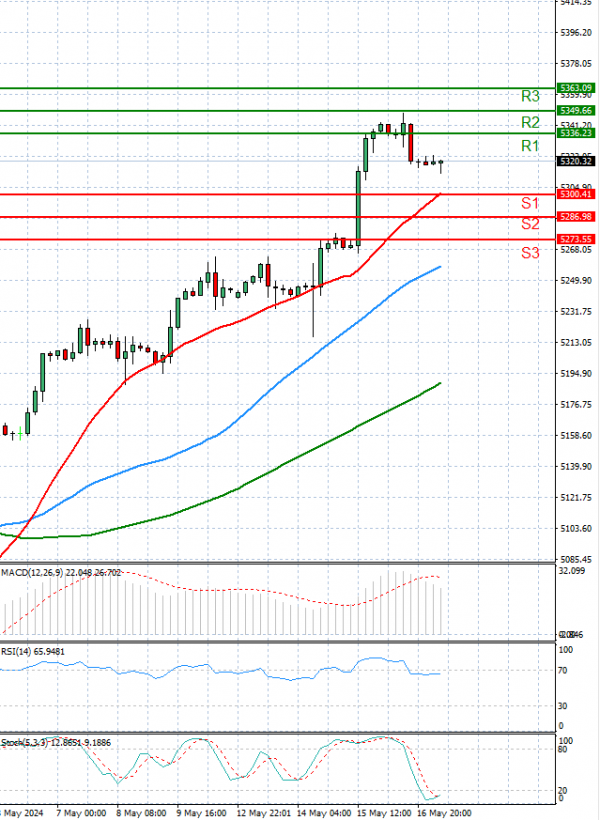
The USA500 is currently trading below 5,300 levels.

U.S. stock futures were indecisive on Friday following a slight decline on Wall Street in the preceding session, as the momentum triggered by benign inflation data earlier in the week waned.

Dow futures, S&P 500 futures, and Nasdaq 100 futures showed minimal change.

On Thursday, the main indices retreated, with the Dow Jones Industrial Average, comprising 30 stocks, scaling back its gains after briefly touching an intraday high of 40,000 for the first time. Both the S&P 500 and the tech-focused Nasdaq Composite also closed lower for the trading session.

Technical analysis

USA500 Analysis Technical analysis 17/05/2024
Time Frame: 1 hour

USA500 Support & Resistance Table - 17/05/2024

Support & Resistance Level Explanation
Resistance 2 5349.66 Daily R2
Resistance 1 5336.23 Daily R1
Support 1 5300.41 Daily S1
Support 2 5286.98 Daily S2

USA500 Indicator Table - 17/05/2024

Indicator Signal
SMA 20 Buy
SMA 50 Buy
SMA 100 Buy
MACD( 12;26;9) Buy
RSI (14) Buy
Stochastic ( 9;6;3) Buy

USA500 Indicator / Period Table - 17/05/2024

Indicator / Period Day - BuyWeek - BuyMonth - Buy
MACD( 12;26;9) Buy BuyBuy
RSI (14) Buy BuyBuy
SMA 20 Buy BuyBuy

USA500 17/05/2024 - Reference Price : 5318.32

Buy
Simple Moving AverageBuy (3)Sell (0)
Technical Indicators - OscillatorsBuy (3)Sell (0)
Share It With Your Network
USA500 Chart
Update Time: -
Highest
Lowest
1M 5M H D W
Prices are loading..
Ready for trading?Start Now