CFDs are complex instruments and come with a high risk of losing money rapidly due to leverage. 70% of retail investor accounts lose money when trading CFDs with this provider. You should consider whether you understand how CFDs work and whether you can afford to take the high risk of losing your money.
CFDs are complex instruments and come with a high risk of losing money rapidly due to leverage. 70.41% of retail investor accounts lose money when trading CFDs with this provider. You should consider whether you understand how CFDs work and whether you can afford to take the high risk of losing all your money. Read full risk warning.

USA500 Analysis

US Session Analysis for CFD Instruments 11/07/2024

Fundamental analysis

11 July, 2024

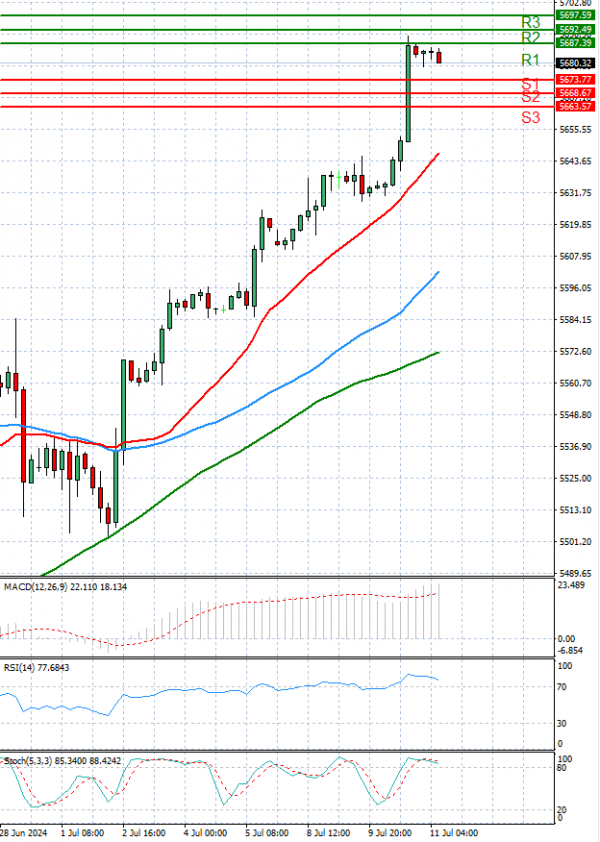
The USA500 is currently trading above 5,600 levels.

U.S. stock futures dipped slightly on Thursday, pulling back from record highs as investors awaited key inflation data that could reinforce expectations for a September interest rate cut.

Dow futures were down by 22 points, or 0.1%, S&P 500 futures decreased by 3 points, or 0.1%, and Nasdaq 100 futures fell by 15 points, or 0.1%.

Technical analysis

USA500 Analysis Technical analysis 11/07/2024
Time Frame: 1 hour

USA500 Support & Resistance Table - 11/07/2024

Support & Resistance Level Explanation
Resistance 2 5692.49 Daily R2
Resistance 1 5687.39 Daily R1
Support 1 5673.77 Daily S1
Support 2 5668.67 Daily S2

USA500 Indicator Table - 11/07/2024

Indicator Signal
SMA 20 Buy
SMA 50 Buy
SMA 100 Buy
MACD( 12;26;9) Buy
RSI (14) Buy
Stochastic ( 9;6;3) Buy

USA500 Indicator / Period Table - 11/07/2024

Indicator / Period Day - BuyWeek - BuyMonth - Buy
MACD( 12;26;9) Buy BuyBuy
RSI (14) Buy BuyBuy
SMA 20 Buy BuyBuy

USA500 11/07/2024 - Reference Price : 5680.58

Buy
Simple Moving AverageBuy (3)Sell (0)
Technical Indicators - OscillatorsBuy (3)Sell (0)
Share It With Your Network
USA500 Chart
Update Time: -
Highest
Lowest
1M 5M H D W
Prices are loading..
Ready for trading?Start Now