CFDs are complex instruments and come with a high risk of losing money rapidly due to leverage. 71% of retail investor accounts lose money when trading CFDs with this provider. You should consider whether you understand how CFDs work and whether you can afford to take the high risk of losing your money.
CFDs are complex instruments and come with a high risk of losing money rapidly due to leverage. 70.91% of retail investor accounts lose money when trading CFDs with this provider. You should consider whether you understand how CFDs work and whether you can afford to take the high risk of losing all your money. Read full risk warning.

USA500 Analysis

US Session Analysis for CFD Instruments 22/08/2024

Fundamental analysis

22 August, 2024

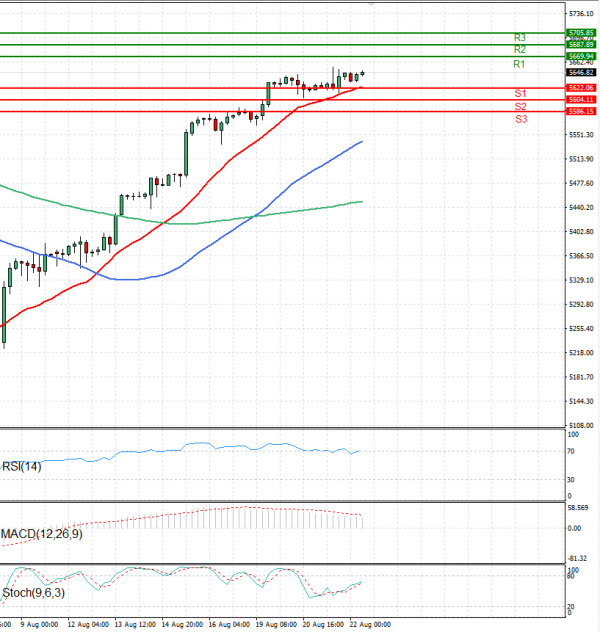
The USA500 is currently trading above 5,640 levels.

On Wednesday, stocks were generally rising after the latest Fed minutes reinforced expectations that officials would likely cut interest rates next month. Traders were also looking ahead to more US data this afternoon and today’s Jackson Hole Symposium.

The Dow futures contract increased by 0.10%, S&P 500 futures were up by 0.04%, and the Nasdaq 100 futures climbed by 0.05%.

Technical analysis

USA500 Analysis Technical analysis 22/08/2024
Time Frame: 1 hour

USA500 Support & Resistance Table - 22/08/2024

Support & Resistance Level Explanation
Resistance 2 5687.89 Daily R2
Resistance 1 5669.94 Daily R1
Support 1 5622.06 Daily S1
Support 2 5604.11 Daily S2

USA500 Indicator Table - 22/08/2024

Indicator Signal
SMA 20 Buy
SMA 50 Buy
SMA 100 Buy
MACD( 12;26;9) Buy
RSI (14) Buy
Stochastic ( 9;6;3) Buy

USA500 Indicator / Period Table - 22/08/2024

Indicator / Period Day - BuyWeek - BuyMonth - Buy
MACD( 12;26;9) Buy BuyBuy
RSI (14) Buy BuyBuy
SMA 20 Buy BuyBuy

USA500 22/08/2024 - Reference Price : 5646.82

Buy
Simple Moving AverageBuy (3)Sell (0)
Technical Indicators - OscillatorsBuy (3)Sell (0)
Share It With Your Network
USA500 Chart
Update Time: -
Highest
Lowest
1M 5M H D W
Prices are loading..
Ready for trading?Start Now